New main ICOS data releases (Level 2, final quality controlled data)
The ICOS network has made available three new final quality controlled (Level 2) data products. These releases cover all three domains and include observational data from all labelled ICOS stations. Many new stations have got their ICOS label certified, so the ICOS data set has now not only expanded in time with another year of data but also with respect to the spatial coverage. You can access and preview the data from the Main Data Products page or look them up in the ICOS Portal App.
Here a short summary of all three data sets:
- Atmosphere: 2020-1 prelease of the Level 2 time series at 23 stations (62 vertical levels) for CO2, a final release 2020-1 for CH4, CO, 14CO2 and meteorology will follow end of August 2020, time coverage is September 2015 until May 2020 (Product page)
- Ecosystem: 2020-1 release of the Level 2 flux data at 16 stations, time coverage is January 2016- December 2019 (Product page)
- Ocean: 2020-1 release of Level 2 time series at 3 stations, 108 cruises, time coverage January 2017 - December 2019 (Product page)
The data is complemented by earlier releases of corresponding historic (pre-ICOS) time series produced in the framework of the Drought 2018 initiative (Ecosystem Product Page and Atmosphere Product Page), this data is not of guarantueed ICOS quality.
Atmosphere also offers daily updates of Near Real Time data (Product page) with maximum 24 hours delay. This data starts at the end of the latest Level 2 release (currently either 2019-1 or 2020-1pre). Ocean provides also Near Real Time data, for example for the autonomous sail drone (Portal app link). This summer Ecosystem will start to provide Near Real Time data with maximum 24 hour delay.
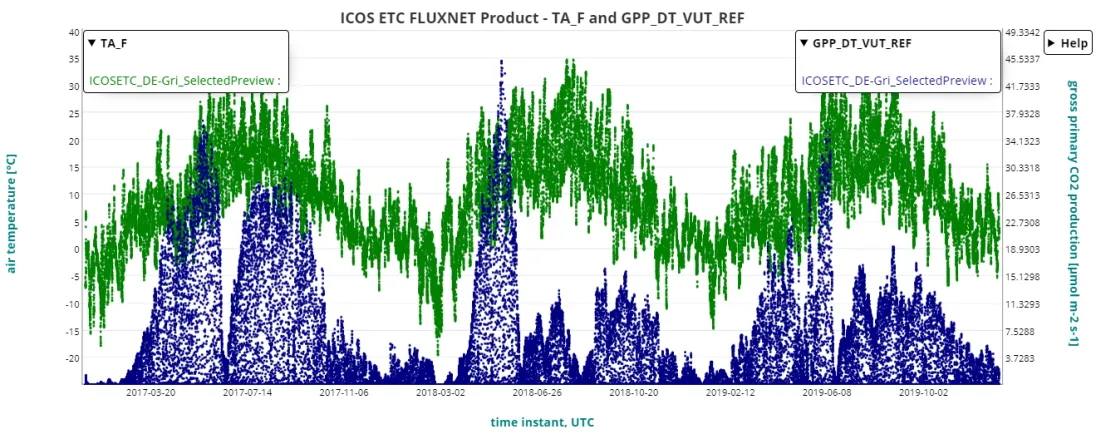
The picture on this page is a preview plot from the Carbon Portal of ecosystem data, part of this release, for station DE-Gri (Grillenburg), showing hourly Temperature and GPP (Gross Primary Productivity, a measure for the carbon storage by the ecosystem) as measured at this station over the years 2017-2019. One can clearly see the uptake increasing in spring and summer and dips of GPP in mid-summer caused by drought, particularly during the 2018 summer drought, but also 2019 shows a extended dip.