ICOS Atmosphere Network Trend of Carbon Dioxide
This tool interactively displays CO2 concentration (formally known as CO2 mole fraction in dry air) measured at 39 ICOS Atmosphere stations. You will see the monthly average CO2 displayed over time. The tool calculates the atmospheric CO2 growth rate seen by the network for the displayed period. For more information about the tool, click on the About tab within the tool.
 In addition to the ICOS monthly averages of CO2 concentrations, the tool also displays the global average CO2 as estimated by NOAA, based on their global network; this setting can be disabled by unchecking the Show global average checkbox. Because the NOAA global average CO2 includes many stations with low variability that are far from human influenced sources and sinks, including the Southern Hemisphere and oceans, this line will have a lower value and less seasonal variation than the ICOS data; however, the overall underlying trend should be the same, as is indeed illustrated by this tool.
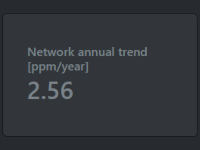 Please note that the CO2 growth trend based on the ICOS data, which updates to show you the trend calculated over your selected time period, will be close to the numbers that NOAA or WMO publish for the global average CO2 growth rate but not exactly the same; additionally, the ICOS calculation has a larger uncertainty. The methods to calculate these numbers differ with respect to exact calculation method, timing and area representativity of the networks. An advantage of the data from ICOS is that our Near Real Time data is available with less than 24 hours delay, allowing us to quickly notice changes and anomalies from our European region.
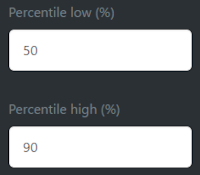 The graph shows a dark and a light shaded area. These represent the percentile values of the monthly observations in the network, where, for example, the 90th percentile represents 90% of the measured values centred around the median (the 50th percentile value), displaying all values that lie between the 5th and the 95th percentile values. If this data were normally distributed, this would represent the 2 sigma confidence level, where IPCC scientists would say that all values are almost certain in that range. The dark shaded area can be set to show, for example, the 50th percentile, displaying half of the measurements, those with values between the 25th and the 75th percentile.
 You can set the time period from which data should be used by changing the Date Range at the bottom left.
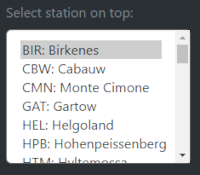 You can also view data from certain stations, which will be displayed on top of the average. To select multiple stations, you can use the Ctrl key (Cmd on Mac) and click on other stations. The selected stations will have opaque markers in the Station map, accessible by clicking on the Station map tab above the graph.
 Enable the Show hourly data option to show all individual hourly measurements for one selected station, the one closest to the top of the list. Note that this will show all the variability in CO2, which may appear to be noise, but is not. This signal carries actual information on all the sources and sinks of CO2 that have contributed to the composition of the air before it arrived at the station.
Scientists will use atmospheric transport models and so call data assimilation methods to "invert" this signal to derive better estimates of the CO2 sources and sinks from the signal at the ICOS stations. This improved understanding of the sources and sinks of CO2 is one of the main goals of ICOS, and is needed to inform the general public and policy makers on the state of the carbon cycle, our progress in mitigating CO2 emissions and developing feedbacks between climate change (warming) and net exchange of CO2 from land and ocean (as well as other greenhouse gases like CH4 and N2O).
Citation: ICOS RI, Apadula, F., Arnold, S., Bergamaschi, P., Biermann, T., Chen, H., Colomb, A., Conil, S., Couret, C., Cristofanelli, P., De Mazière, M., Delmotte, M., Di Iorio enea, T., Emmenegger, L., Forster, G., Frumau, A., Haszpra, L., Hatakka, J., Heliasz, M., Heltai, D., Hensen, A., Hermansen, O., Hoheisel, A., Kneuer, T., Komínková, K., Kubistin, D., Larmanou, E., Laurent, O., Laurila, T., Lehner, I., Lehtinen, K., Leskinen, A., Leuenberger, M., Levula, J., Lindauer, M., Lopez, M., Lund Myhre, C., Lunder, C., Mammarella, I., Manca, G., Manning, A., Marek, M.V., Marklund, P., Meinhardt, F., Molnár, M., Mölder, M., Müller-Williams, J., O'Doherty, S., Ottosson-Löfvenius, M., Piacentino, S., Pichon, J.-M., Pitt, J., Platt, S.M., Plaß-Dülmer, C., Ramonet, M., Rivas-Soriano, P., Roulet, Y.-A., Scheeren, B., Schmidt, M., Schumacher, M., Sferlazzo, D., Sha, M.K., Smith, P., Stanley, K., Steinbacher, M., Sørensen, L.L., Trisolino, P., Vítková, G., Yver-Kwok, C., Zazzeri, G., di Sarra, A., ICOS ATC-Laboratoires des Sciences du Climat et de L'Environnement (LSCE), France, ICOS Central Radiocarbon Laboratory (CRL), Germany, ICOS Flask And Calibration Laboratory (FCL), Germany, 2024. ICOS Atmosphere Release 2024-1 of Level 2 Greenhouse Gas Mole Fractions of CO2, CH4, N2O, CO, meteorology and 14CO2, and flask samples analysed for CO2, CH4, N2O, CO, H2 and SF6. https://doi.org/10.18160/0F1E-DKXT