FLUXES Editorial

Science’s role in decarbonising cities
Even if the political winds currently seem to be blowing in a different direction, decarbonisation is the order of the day. The rise in greenhouse gases continues, and we are on the way to rendering entire regions of this planet uninhabitable. It’s pointless to deny this scientific finding. Cities are on the front lines of climate action, and they need scientific knowledge to support their ambitious decarbonisation plans. As a biologist and ecosystem scientist, I believe that the role of science has further developed from understanding our planet, towards using this knowledge to preserve it as a liveable habitat. Providing cities with the practical tools they need to achieve their climate goals is an important purpose of climate science.
For a city to truly tackle its greenhouse gas emissions, it must first know what it’s up against. While many cities have emissions inventories, these are often based on broad estimates. To truly improve these, cities need a way to accurately identify the types of emissions and their exact sources. This is where science comes in. By using scientific analysis and real-time monitoring, we can validate a city’s estimated carbon reductions and reveal what climate actions are working. This is crucial because a well-intentioned initiative might not yield the expected results. The more science a city integrates into its planning and monitoring, the better it can adapt and refine its strategies.
The ICOS Cities project was designed to push the boundaries of what is possible. In our three pilot cities, Paris, Zurich, and Munich, we intentionally ‘over-instrumented’ our sites to determine which emission observation methods are most effective. This innovative process helps us directly link our measurements to specific climate actions. For example, a distributed network of sensors can track changes in traffic or heating emissions, directly connecting them to a new policy or initiative.
This process is what I call ‘inventory plus’. The main goal is to create a better, more accurate city emissions inventory by integrating real-world observations, scientific analysis, and models to add crucial, actionable knowledge. Our work has already shown how direct measurements can either validate or challenge existing inventory assumptions, providing a significant boost to the effectiveness of climate action.
Cities are a major part of the EU’s ambitious climate promises, and monitoring emissions is like a runner’s watch when they’re preparing for a marathon – it’s essential for tracking progress. The EU can play a vital role by creating a legal framework for greenhouse gas observations and monitoring, similar to what already exists for air quality.
Science is not just an academic pursuit; it is a vital partner for cities in their race to decarbonise. By embracing advanced monitoring and measurement techniques, cities can transform their climate aspirations into measurable, lasting progress.
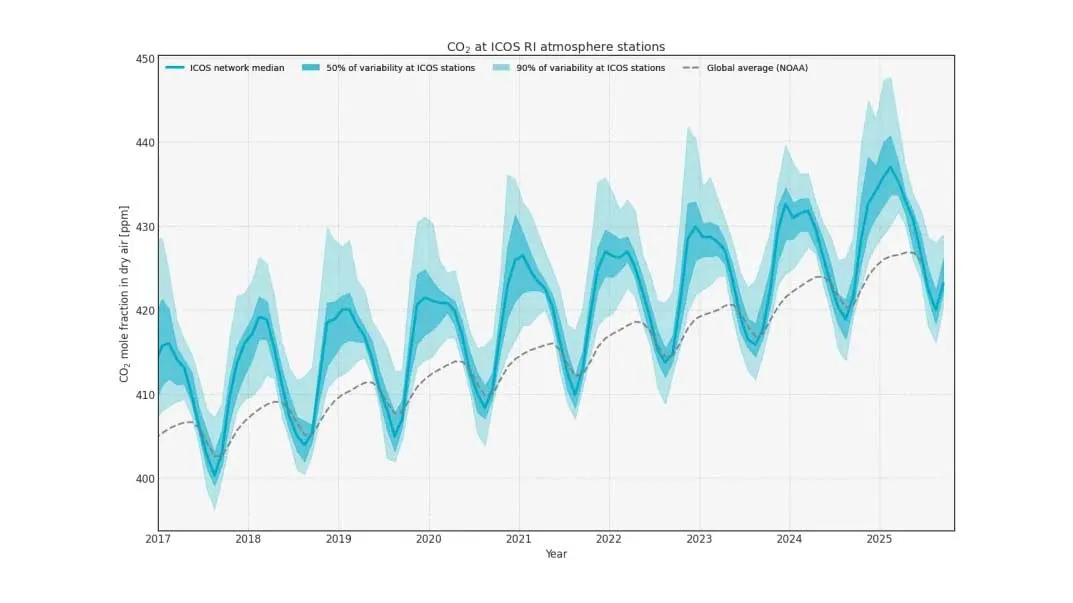
Global atmospheric CO2 concentrations continue to rise
The annual growth rate of carbon dioxide was 3.29 ppm/year in 2024, recent ICOS data show. This is an increase compared to previous years and yet another year off track from the goals of the Paris Agreement.
There are two main reasons behind the growing numbers:
- Continued fossil fuel use leading to record-high emissions of greenhouse gases
- A weakening of CO2 sinks, like the terrestrial ecosystems
Terrestrial ecosystems are weakening in response to the rising global temperature. Extreme events like droughts and heatwaves disrupt plant growth and photosynthesis, which are processes that absorb atmospheric CO2. Consequently, more of the CO2 from fossil fuel emissions remains in the atmosphere and the atmospheric growth rate continues to increase.
The ICOS Curve data can be compared to other datasets, like the NOAA global average, that shows the background CO2 levels from sites located farther away from emission sources. Because of closer proximity to emission sources like cities and industries, the ICOS Curve shows higher concentrations.

The ICOS Curve
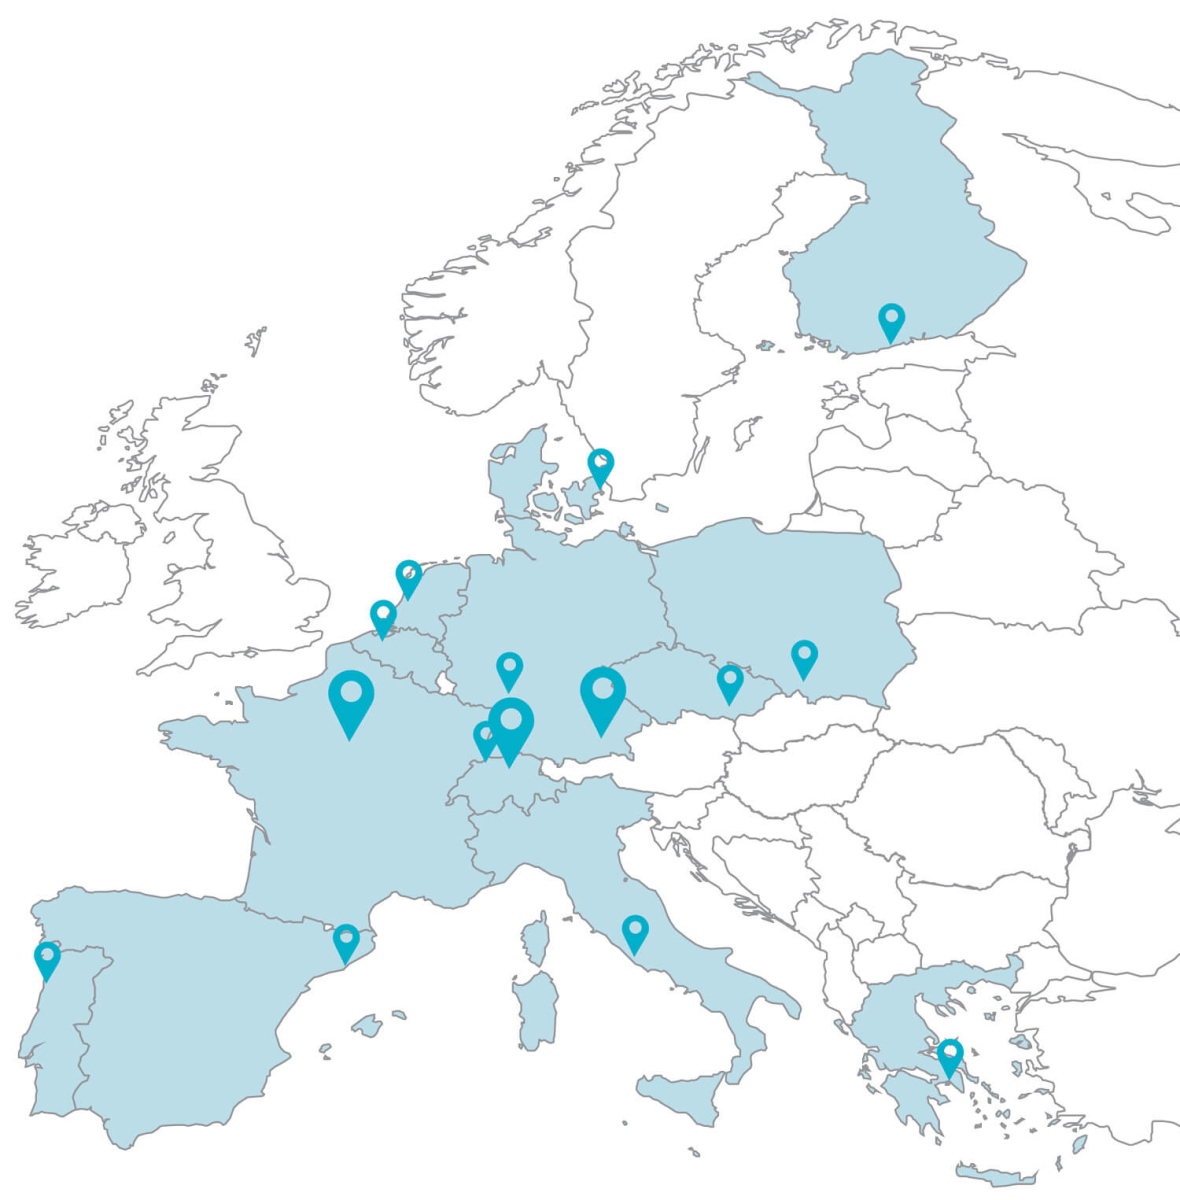
Near-Real-Time data is used to update the curve daily. The stations provide standardised, high-precision data.
The European CO2 concentrations from ICOS atmosphere stations can be viewed via a graphical interface. The graph can be customised by selecting for example specific countries or regions, comparisons with the NOAA global average or Mauna Loa data.
The Curve tool is publicly accessible on the ICOS website: icos-ri.eu and curve.icos-ri.eu.