
Cities exploring new technology for emissions monitoring
Knowing whether climate actions are effective is crucial for cities, but gathering precise, up-to-date emissions data is a challenge. Advanced sensor technology can help, providing frequent, accurate updates and empowering urban centres striving towards a low-emission future.
Key takeaways
- New technology provides accurate greenhouse gas data. Advanced sensor networks are a game-changer, offering a powerful and precise way to monitor emissions in real-time.
- Hybrid approaches are the future. The most effective strategy for cities is to combine traditional emissions inventories with new sensor technology for more accurate and useful data.
- Data empowers policymakers. Taking a hybrid approach helps cities verify emission totals and gives policymakers the specific, detailed information they need to design, evaluate, and improve climate policies.
The first step for local governments looking to understand their carbon footprint is to compile the emission-producing activities in the city into an emissions inventory.
Inventories have become the global standard for reporting emissions thanks to their inclusion in the Paris Climate Agreement.1 Signatory countries are obliged to report their national greenhouse gas emissions annually. Ambitious local governments can also choose to track their emissions, although they have no mandated timeframe in which to do this.
These inventories use information from the public and private sectors to quantify emissions-producing activities, such as electricity production, traffic, heating and cooling in buildings, industry, and waste management.
“Emissions inventories are fundamental to setting climate goals,” says Dr Hugo Denier van der Gon, Principal Scientist on Air Quality and Climate at the Dutch Organisation for Applied Scientific Research (TNO).
“You cannot create meaningful climate actions without an inventory. If you don’t know what your emission source sectors are and how big they are, you are working in the dark,” he explains.
However, while inventories provide valuable data and are useful for identifying emissions sources, they usually do not offer the level of detail needed to take action and mitigate emissions.
Limitations of traditional inventories
Policymaker’s detailed questions, such as which buildings are producing the most emissions or the benefits of planting trees along a particular road, are generally too specific for emissions inventories to answer.
“Many cities lack access to timely, local, and precise data with high spatial resolution,” says Dr Ivonne Albarus, Senior Science Officer, Working Group I, Technical Support Unit at the IPCC.
“The accuracy of emissions inventories depends on the availability of local data, such as the number of cars, the fuel type they use, the amount and origin of the energy consumed in the city, and so on,” she explains.
Inventories fail to capture when and where emissions are most intensive as they are updated annually at most and take a broad view of the entire city, says Dr Jocelyn Turnbull, Principal Scientist, Carbon Cycle at the New Zealand Institute for Earth Science.
“Emissions inventories are great for tracking how whole-city emissions are evolving over time, but we need more detailed, granular information if we want to be able to see where the opportunities for mitigation are and track how well specific mitigation actions are working,” she explains.
We need more detailed, granular information if we want to be able to see where the opportunities for mitigation are and track how well specific mitigation actions are working.
Mapping emissions in real-time
In contrast to emissions inventories, atmospheric greenhouse gas observations are based on readings from sensors in strategic locations around cities. This technology allows cities to map greenhouse gas emissions in real-time time. As part of the ICOS Cities project, Paris, Zurich, and Munich, complemented their statistical emissions inventories with direct greenhouse gas observations.
“Our measurements provide an independent, faster method of observing emissions,” says Dr Lukas Emmenegger, Head of Laboratory at Empa, Swiss Federal Laboratories for Materials Science and Technology, and scientific team lead for Zurich in the ICOS Cities project.
“It’s instrumental to have an independent method that shows whether what you aimed for is actually being observed in the atmosphere.”
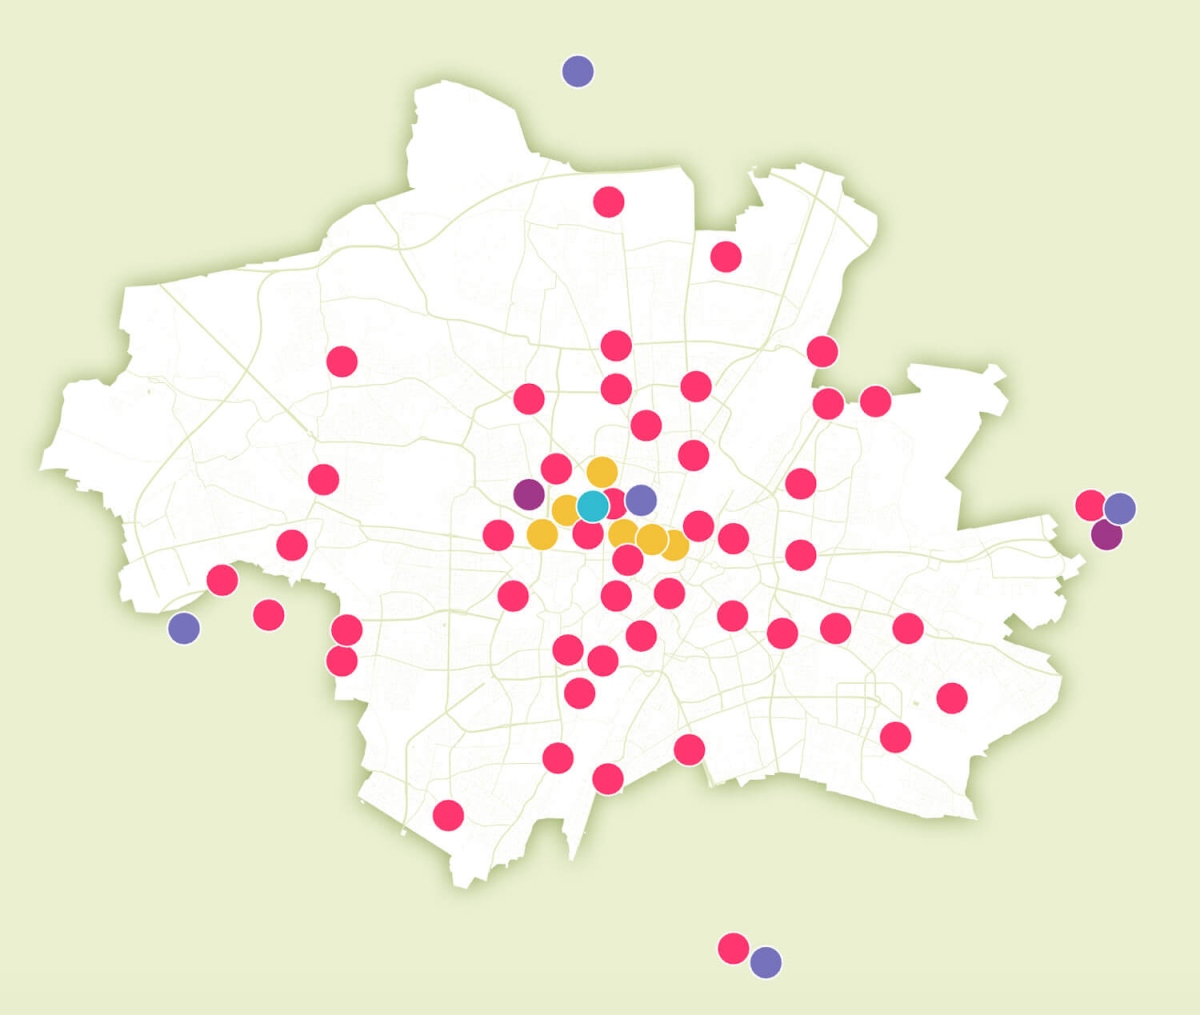
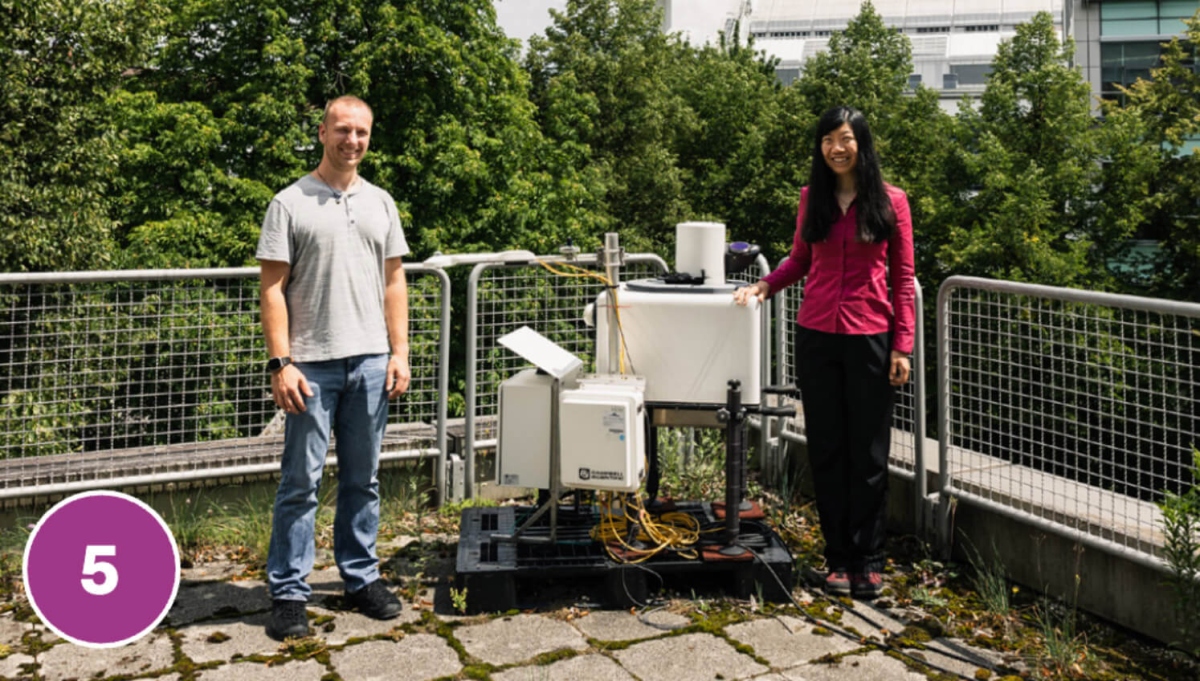
In the ICOS Cities project, sensors were positioned across the three pilot cities in a variety of ways: strapped to tree trunks and lampposts, installed on rooftops, and even attached to mobile phone network base stations.
The project started gathering data in 2022 and is set to conclude at the end of 2025, with selected networks expected to become permanent fixtures.
The sensors ranged in price and accuracy, from a hundred euros to hundreds of thousands of euros for the high-end equipment. Using the cheaper sensors allowed for a greater quantity to be installed and more readings to be collected. Meanwhile, the more sophisticated, expensive instruments on rooftops or towers allowed scientists to obtain precise measurements and see more subtle changes in greenhouse gas concentrations.
The sensor networks unveiled fascinating insights into the fluctuating emission patterns across each city.
Inventories and observations working hand-in-hand
The ICOS Cities project’s findings show that combining emissions inventories with atmospheric observations provides the most accurate and useful information for local governments.
“The atmospheric observation will tell you your total emissions have decreased by 10% – OK, great, but why? You still need to understand the emission sources, which will allow you to pinpoint in which sectors reductions were achieved. That’s where the inventory side comes in,” says Professor Thomas Lauvaux at the University of Reims.
The atmospheric observation will tell you your total emissions have decreased by 10% – OK, great, but why? You still need to understand the emission sources, which will allow you to pinpoint in which sectors reductions were achieved.
For Professor Lauvaux, atmospheric observation is a verification step that allows cities to check the accuracy of their inventories:
“The atmospheric monitoring system is almost like having an accountant that goes line by line to verify the totals.”
This argument is echoed by Dr Turnbull: “We like to say that the atmosphere can’t lie – it sees the sum of all the emissions, mixed together. So, by combining the atmospheric observations with enhanced inventory-methods, we can find out where our inventories are working well, and where they are getting things wrong.”
Combining emissions inventories with atmospheric observations can also help citizens follow their city’s climate action, says Dr Denier van der Gon.
“Policymakers and citizens don’t generally have an idea of what changes in greenhouse gas concentrations mean, but if you translate it to data that are available in emissions inventories, such as saying that saving so many kilotons of CO2 is equivalent to having 5,000 fewer cars driving in the city centre – people will understand that,” he explains.
Looking to the future
Making use of the captured data is one of the most important factors when setting up a greenhouse gas monitoring network.
“There is a wealth of data becoming available, much more so than was available 10 or 20 years ago. We are still exploring how to work with that wealth of information,” explains Dr Denier van der Gon. “Even very smart individuals cannot do this alone, so artificial intelligence or machine learning techniques will really help us to deal with these huge quantities of information.”
“Artificial intelligence can be used to scale the knowledge gained from larger cities to smaller cities. Rather than saying that, if a city with a population of 500,000 people has a certain number of cars, then a city with 250,000 people will have half that amount, AI can help to extrapolate in a much more sophisticated manner,” he says.
“With artificial intelligence and machine learning, the transfer of knowledge from one city to another will be much more accurate and detailed,” he adds.
The project will also produce guidelines outlining how cities can make the connection between atmospheric observations of greenhouse gases and their emissions inventories.
In the future, there may also be emissions measurements taken from above the atmosphere as satellites can now observe ‘urban plumes’ – rising columns of warm air and greenhouse gases generated by cities, explains Dr Andreas Christen, Professor of Environmental Meteorology at the University of Freiburg.
“They're not yet at the resolution that they can provide emission estimates for smaller cities – they can mostly track large megacities and power plant plumes. But that’s a technology that will improve,” he says.
“This would allow us to calculate emissions not only from a single city or from the cities of a particular region, but worldwide for every city.”

Photo: Jaroslav Monchak
IG3IS Guidelines: A new standard for urban emissions
The recently published 'Urban emission observation and monitoring good research practice guidelines' provide a new framework for cities to accurately monitor and manage their greenhouse gas emissions.
- Purpose: Help cities move beyond basic, city-wide totals and acquire the detailed, reliable and robust emissions data needed to take specific, targeted action. This framework uses atmospheric information to supplement traditional activity-based data.
- Tailored approach: Recognising that every city is unique, the guidelines highlight the pros and cons of all available greenhouse gas observational measurement methods. This allows cities to choose the most suitable approach based on their specific needs, geography, climate, and available resources.
The guidelines have been produced by the Integrated Global Greenhouse Gas Information System (IG3IS) and the World Meteorological Organization (WMO), with the input from ICOS Cities scientists.
Options for monitoring greenhouse gases in cities
No two cities are alike – therefore, each city requires a tailored set of sensors to accurately monitor greenhouse gas emissions.

1. Roof and street-level sensor networks
Small sensors on roofs and street-lights measure greenhouse gases closer to their source, enabling individual sources to be pinpointed and emission hotspots to be identified.
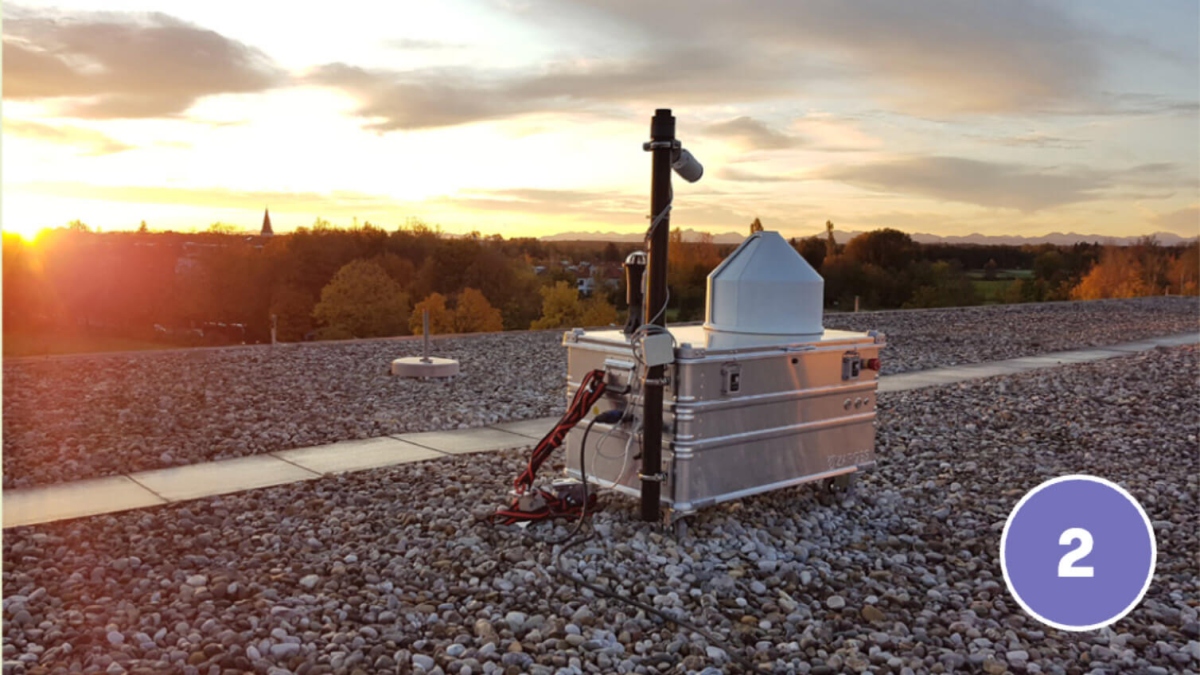
2. Total column measurements
Sun-tracking instruments installed upwind and downwind of a city measure greenhouse gases in the entire atmosphere by tracking very small changes in sunlight due to the greenhouse gas enrichment over the city.

3. Turbulent flux measurements
By simultaneously measuring the strength of wind and greenhouse gas concentrations with specialised equipment on towers over the city, the emissions can be infered from the underlying urban surface.
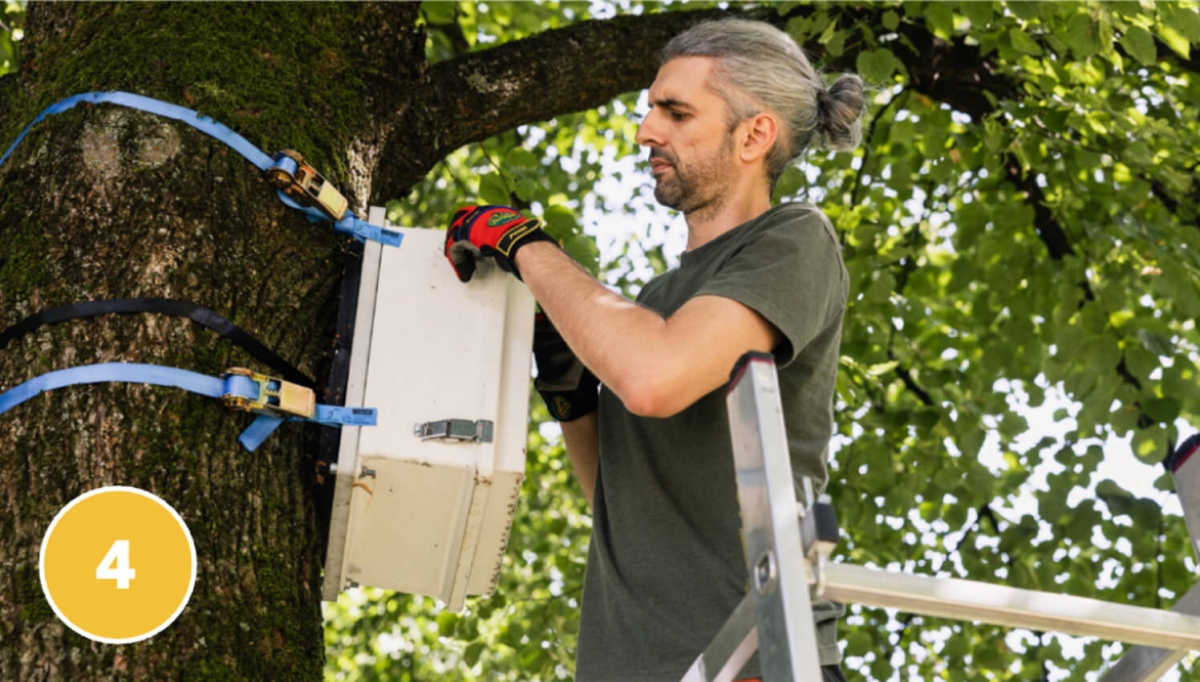
4. Urban biospheric monitoring
Tracking the vitality of vegetation and soil conditions allows the quantity of greenhouse gases released and absorbed by urban nature to be estimated.
5. Atmospheric wind profile observations
Laser beams are used to study the movement of air in the atmosphere up to around 3,000 meters. This is important for understanding how the emitted greenhouse gases spread to different parts of the city.

6. High-precision up- and downwind towers
High-precision sensors on tall towers continuously measure the concentration of greenhouse gases and detect small changes in greenhouse gases upwind and downwind of cities. This tall tower is located in Romainville, Paris.
How do cities assess their emissions?
By Nidhi Misra
Understanding a city’s environmental impact begins with a comprehensive greenhouse gas emissions inventory, quantifying the emissions produced across various sectors.
A greenhouse gas emissions inventory is a systematic assessment of all greenhouse gases produced within a city’s geographical boundaries. It includes emissions from:
- Transportation
- Combustion for residential heating
- Industry
- Waste management
- Other sources, like agriculture and leaks from gas distribution networks
When compiling an inventory, the city starts by gathering activity data, such as fossil fuel consumption within specific sectors, and then multiplies this by an emission factor, such as how much CO2 is released per amount of diesel used.
There are several different guidelines which can help cities to set up their inventories. The most common are:
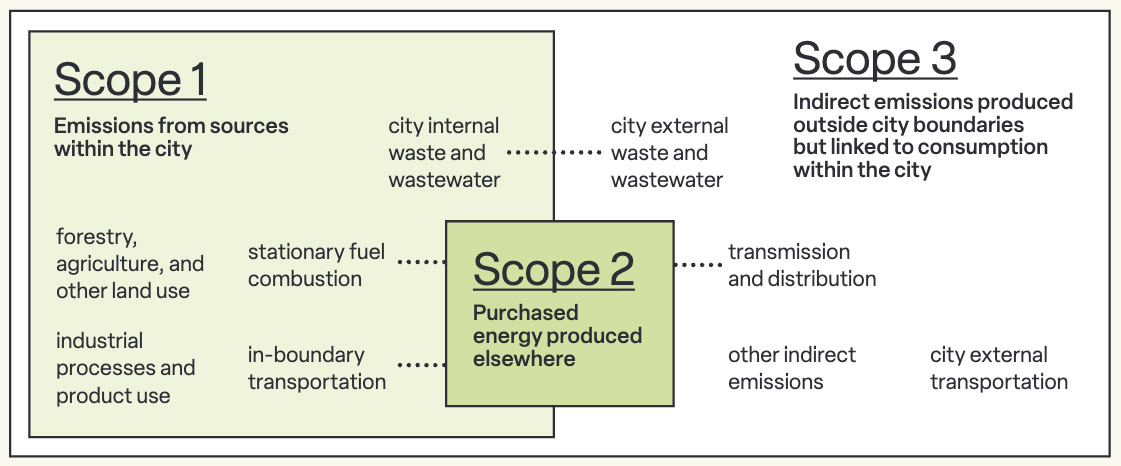
- Global Protocol for Community-Scale GHG Inventories (GPC), which organises emissions into three scopes (see infographic)
- Baseline Emissions and Monitoring Inventory BEI/MEI, which tracks energy consumption to guide local sustainable energy and climate action plans
- Hybrid or national methods like France’s Bilan Carbone Methodology or Germany’s BISKO Standard that combine local data collection practices with national data sources and international standards
- Official reporting platforms, like the CDP ICLEI Track and My Covenant tools that cities can use to log their emissions
References
1 Also part of the Kyoto Protocol in 1996 and the UNFCCC National Inventory Documents.