
New ICOS Curve shows CO₂ concentrations and trends over Europe
The ICOS Curve, a new interactive web service published today, shows the dynamics and trends in CO₂ levels in the atmosphere above Europe. It calculates a monthly median CO₂ concentration for the previous month, and a growth rate for the most recent year. The application also allows you to compare CO₂ levels from stations in different places with European and global averages.
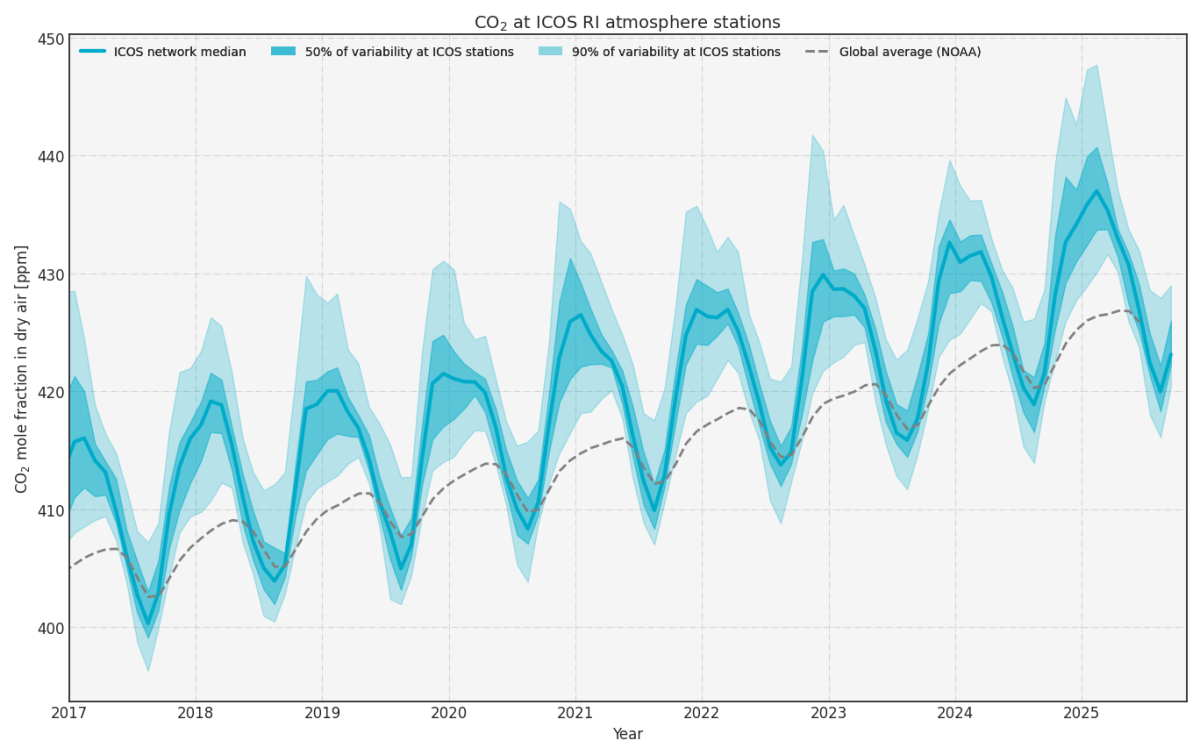
The ICOS Curve provides an easy way to see the greenhouse gas concentrations in different parts of Europe in the same picture.
The tool calculates the median CO2 concentration for Europe for the previous month: for example, this was 423.12 ppm in September 2025. The tool also calculates the median CO2 concentration for any time period the user has selected. Users can follow the trend over the past decades and estimate how the annual growth rate has developed over time.
The current growth rate is calculated for the most recent full year. In 2024, the CO2 growth rate was 3.29 ppm for the certified (labelled) ICOS Atmosphere stations on the Northern Hemisphere. This is a strong acceleration compared to 10 years ago when the Paris Agreement was accepted: between 2011 and 2020, the growth rate was 2.5 ppm per year. It shows that humanity has not managed the turnaround yet, and that we are still running into a severe climate crisis.
The ICOS Curve web service uses high-quality and standardised observation data from 38 ICOS Atmosphere stations in the Northern Hemisphere. The curve is updated daily based on ICOS Near Real Time and Fast Track data.
ICOS network ensures continuity in climate monitoring
“The ICOS Curve is an important addition to the global efforts informing about the atmospheric composition of greenhouse gases. Since it’s updated daily, it provides timely information relevant for climate action and decision making. This additional set of observations is crucial in these days to secure that the world stays well informed about climate change and its underlying reasons,” says Werner Kutsch, Director General of ICOS.
ICOS measurements are funded by the 16 European member countries of ICOS. For this reason, the network ensures continuity and transparency in climate monitoring.
“The global scientific community is working with the World Meteorological Organization (WMO) to build a global measurement network, the Global Greenhouse Gas Watch. An operational, dense network such as ICOS covering the planet would allow to track global emissions and uptake by oceans and land ecosystems without delay,” Werner Kutsch continues.
The ICOS Curve was published right before the UN climate negotiations, COP30, started on 10th November. It was immediately added as a further resource provided for the COP30 Earth Information Day 2025 participants.
A visualisation tool for teaching and presentations
The ICOS Curve visualisation tool can be used in presentations, teaching, or when communicating about climate science. The web application allows user to select stations, the time frame, and produce a graph that fits their interests. For example, it is possible to select a background station in the ocean with little regional influence and compare it with a station in a densely populated, high-emissions area in central Europe. It’s also possible to calculate growth rates for different time periods.
“Like the whole ICOS research infrastructure, the ICOS Curve web service is a joint effort of our community. It is a brilliant tool that results from the decades-long data standardisation, the dedicated work of technicians and scientists at the dozens of measurement stations, and many other committed people across the ICOS organisation. I am grateful to all these colleagues,” Werner Kutsch notes.
ICOS scientists are already working on further visualisations based on the ICOS Ecosystem and Ocean station data.
Interested users can browse more ICOS greenhouse gas data from atmosphere, ecosystem and ocean measurements at the ICOS Carbon Portal.
Learn more about the ICOS Curve.