The complex chemistry behind the alarming growth in methane
The natural carbon sinks might support us in our last stretch towards carbon neutrality. However, the atmosphere is very complex. Methane concentrations have been on the rise since 2007, with a record growth rate in Europe in 2020-2021. Reasons for the growth are human-induced emissions, the chemical interplay of gases, and increased natural emissions caused by climate change.
By the beginning of the 21st century, it seemed that the rise in methane concentrations had stabilised. The growth rate of 15 ppb per year (i.e., parts per billion per year), observed in the 1980s, had gradually slowed to 5 ppb per year by the 1990s, and to nearly zero by the early 2000s.
However, around 2007, methane concentrations (CH4) began to rise again at a rate of 5 to 10 ppb per year1. There is more than one reason for this: a major contribution comes from microbial emissions such as wetlands, waste sector and agriculture, but other sources such as fossil fuel emissions, also play a role2,3. This has been studied using worldwide monitoring networks, including isotopic measurements, which are used to differentiate between fossil fuel and other methane sources.
In addition to the slow varying trend, there are year-to-year variations such as the 2014-2016 El Niño, which increased methane emissions from tropical wetlands4.
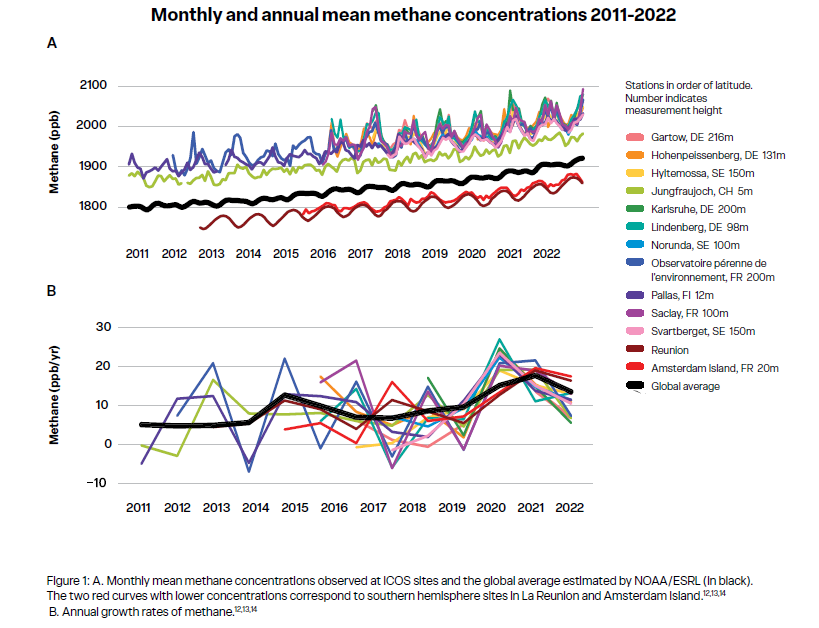
Measurements from the ICOS network indicate a record growth of methane across Europe in 2020/2021, with growth rates exceeding 10 ppb per year, or even 20 ppb per year at some ICOS stations, before returning to below 10 ppb per year growth in 2022, as seen in Figure 1. The acceleration of methane growth in 2020, by about 50%, is surprising since it occurred during the COVID-19 lockdowns, a period in which there were marked reductions in many human-related emissions. Reductions in CO2 emissions were about 9% in the first half of 20205, with decreases of nearly 20% on daily emissions in early April 20206. The drastic reduction of surface and air traffic also led to a sharp decrease in nitrogen oxides (NO2) emissions, to the order of 20-30% in spring 2020 in Eastern China, Europe and North America, and even larger decreases (3%–50%) in South America7.
COVID-19 related reductions of methane emissions were more difficult to observe than those of CO2. Methane is emitted from many sources, and lockdowns did not affect natural sources8. In addition, the concentration of methane in the atmosphere does not only depend on emissions, but also on how methane reacts with other gases in the atmosphere, such as nitrogen oxides, carbon monoxide (CO) and the hydroxyl radical (OH). OH is known as the “detergent of the atmosphere” as it oxidises methane to water vapour and formaldehyde. During the lockdowns, there were lower NOx emissions, and therefore fewer OH radicals available, which meant methane stayed in the atmosphere for longer. It is estimated that the decrease of the methane photochemical sink associated with the reduction of nitrogen oxide emissions accounts for about half of the 2020 growth rate difference to normal10.
The methane growth rates illustrate the complexity of the methane concentrations in the atmosphere, where natural and anthropogenic processes are interlinked.
The other possible reason to the exceptionally high growth rate in 2020 is the increased natural emissions from wetlands, which was caused by large rainfalls in the tropics and high up in the Northern Hemisphere4,9. Preliminary analyses for 2021 indicate that natural emissions from the wetlands in the northern tropics account for an even larger share in the methane growth rate. Interestingly, measurements from the European ICOS stations from 2022 indicate growth rates returning to levels prior to 2020-2021 as seen in figure 1B. However, stations located in the southern hemisphere, such as La Reunion and Amsterdam Island still show high growth rates in 2022. The mean global growth rate estimated by the National Oceanic and Atmospheric Administration Earth System Research Laboratories lies between that of the European and Southern Hemisphere stations.
This change in methane growth rate illustrates the complexity of the methane concentrations in the atmosphere, where natural and anthropogenic processes are interlinked, and where the cycles of many atmospheric compounds play a role.
References
1Lan, X., E. G. Nisbet, E. J. Dlugokencky, and S. E. Michel (2021). What do we know about the global methane budget? Results from four decades of atmospheric CH(4) observations and the way forward. Philos Trans A Math Phys Eng Sci, 379(2210), 20200440.
2Saunois, M., P. Bousquet, B. Poulter, A. Peregon, P. Ciais, J. Canadell, E. Dlugokencky, G. Etiope, D. Bastviken, S. Houweling, G. Janssens-Maenhout, F. Tubiello, S. Castaldi, R. Jackson, M. Alexe, V. Arora, D. Beerling, P. Bergamaschi, D. Blake, . . . Q. Zhu (2017). Variability and quasi-decadal changes in the methane budget over the period 2000–2012. Atmospheric Chemistry and Physics, 17(18), 11135-11161.
3Jackson, R. B., M. Saunois, P. Bousquet, J. G. Canadell, B. Poulter, A. R. Stavert, P. Bergamaschi, Y. Niwa, A. Segers, and A. Tsuruta (2020). Increasing anthropogenic methane emissions arise equally from agricultural and fossil fuel sources. Environ. Res. Lett., 15(7), 071002
4Feng, L., P. I. Palmer, R. J. Parker, M. F. Lunt, and H. Boesch (2022). Methane emissions responsible for record-breaking atmospheric methane growth rates in 2020 and 2021. Atmos. Chem. Phys. Discuss., 2022, 1-23.
5Liu, Z., P. Ciais, Z. Deng, R. Lei, S. J. Davis, S. Feng, B. Zheng, D. Cui, X. Dou, B. Zhu, R. Guo, P. Ke, T. Sun, C. Lu, P. He, Y. Wang, X. Yue, Y. Wang, Y. Lei, . . . H. J. Schellnhuber (2020). Near-real-time monitoring of global CO2 emissions reveals the effects of the COVID-19 pandemic. Nature Communications, 11(1), 5172.
6Le Quéré, C., R. B. Jackson, M. W. Jones, A. J. P. Smith, S. Abernethy, R. M. Andrew, A. J. De-Gol, D. R. Willis, Y. Shan, J. G. Canadell, P. Friedlingstein, F. Creutzig, and G. P. Peters (2020). Temporary reduction in daily global CO2 emissions during the COVID-19 forced confinement. Nature Climate Change, 10(7), 647- 653.
7Doumbia, T., C. Granier, N. Elguindi, I. Bouarar, S. Darras, G. Brasseur, B. Gaubert, Y. Liu, X. Shi, T. Stavrakou, S. Tilmes, F. Lacey, A. Deroubaix, and T. Wang (2021). Changes in global air pollutant emissions during the COVID-19 pandemic: a dataset for atmospheric modeling. Earth Syst. Sci. Data, 13(8), 4191- 4206.
8Saunois, M., A. Stavert, B. Poulter, P. Bousquet, J. Canadell, R. Jackson, P. Raymond, E. Dlugokencky, S. Houweling, P. Patra, P. Ciais, V. Arora, D. Bastviken, P. Bergamaschi, D. Blake, G. Brailsford, L. Bruhwiler, K. Carlson, M. Carrol, . . . Q. Zhuang (2020). The Global Methane Budget 2000–2017. Earth System Science Data, 12(3), 1561-1623.
9Peng, S., X. Lin, R. L. Thompson, Y. Xi, G. Liu, D. Hauglustaine, X. Lan, B. Poulter, M. Ramonet, M. Saunois, Y. Yin, Z. Zhang, B. Zheng, and P. Ciais (2022). Wetland emission and atmospheric sink changes explain methane growth in 2020. Nature, 612(7940), 477-482.
10Stevenson, D. S., R. G. Derwent, O. Wild, and W. J. Collins (2022). COVID-19 lockdown emission reductions have the potential to explain over half of the coincident increase in global atmospheric methane. Atmos. Chem. Phys., 22(21), 14243-14252.
11Masarie, K.A. and P.P. Tans, (1995), The growth rate and distribution of atmospheric methane, J. Geopys. Research, vol. 100, 11593-11610
Data citations
Figure 11. ICOS Near Real-Time (Level 1) Atmospheric Greenhouse Gas Mole Fractions of CO2, CO and CH4, growing time series starting from latest Level 2 release, https://doi.org/10.18160/ ATM_NRT_CO2_CH4;
Lan, X., K.W. Thoning, and E.J. Dlugokencky: Trends in globallyaveraged CH4, N2O, and SF6 determined from NOAA Global Monitoring Laboratory measurements. Version 2023-06, https:// doi.org/10.15138/P8XG-AA10,
Ramonet M., Lopez M., SNO-IFA, 2022. SNO-IFA ATC CH4 L2 Release, Ile Amsterdam (20.0 m), 2012-01-01 - 2022-02-28, https://hdl.handle.net/21.11148/2jg9-8j2m-h8bg