Carbon emissions and sinks vary between the years
These maps present the three major CO2 fluxes for Europe and nearby ocean areas, and their variation from 2018 to 2022: biogenic fluxes of land ecosystems, ocean fluxes, and human emissions from fossil fuels.
The concentration of CO2 in the atmosphere is determined by the interplay between three major fluxes: biogenic land ecosystem fluxes, ocean fluxes, and human-induced emissions. Land and oceans often take up more CO2 from the atmosphere than they release. In net terms, they are considered natural ‘sinks’. Land and ocean sinks are also called ‘nature-based carbon dioxide removal’ and they balance parts of the emissions generated by human activity (fossil fuel burning, land use changes etc) which are ‘sources’ of CO2.
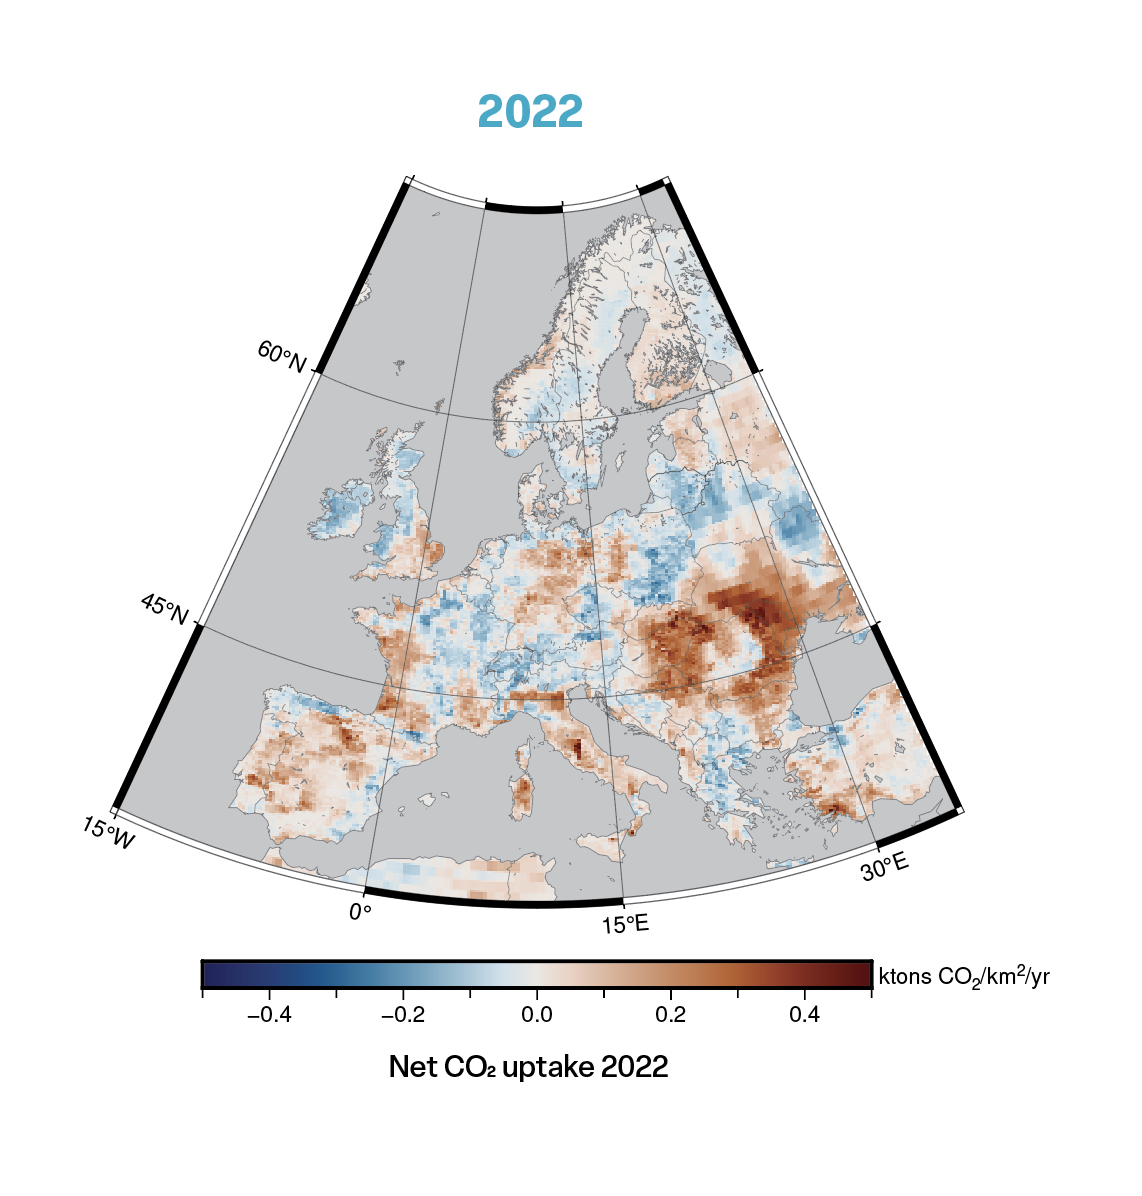
Estimates of annual mean exchange fluxes means of these major fluxes over Europe for the year 2022 are shown in the following maps in the context of the previous years. It is important to note these are highly-integrated products of observations, inventory data, and models. Blue regions show net uptake of CO2 from the atmosphere. In the red areas, more CO2 is released than taken up, thus from these areas there is a net release of CO2 to the atmosphere. Note that the maps show only the CO2 exchanged between the atmosphere and ecosystems/ocean/emission sources - they do not account for carbon moved in or out of the region, for example crops or timber.
The fluxes presented here are annual means. The different fluxes also have widely ranging variability in time. Ocean fluxes show strong seasonal trends, but changes from year to year are rather small. Biospheric fluxes on land ecosystems have high variability and can even change direction from hour to hour, day to day, season to season and year to year. Anthropogenic fluxes vary strongly by the hour and by season, but not so much from year to year and only moderately from day to day. Although the annual average flux of biogenic sources is small compared to the annual average of areas with high fossil fuel emissions because of compensating biogenic sources and sinks, on hourly and daily time scales the fluxes per area are very comparable between biogenic and fossil fuel fluxes.
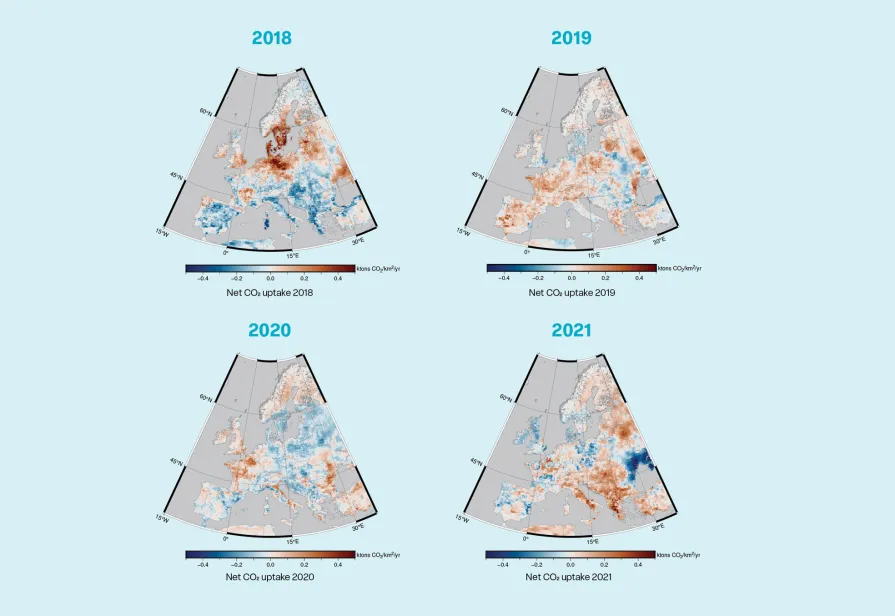
Net carbon dioxide uptake in the land ecosystems
Blue regions show net CO2 uptake of land ecosystems, thus reducing the amount of CO2 in the atmosphere. Red regions show net CO2 loss, so CO2 is released to the atmosphere. In 2022, Italy, parts of France and Germany, most of the Balkan countries, and the Iberian Peninsula showed pronounced carbon losses mainly related to dry weather conditions.
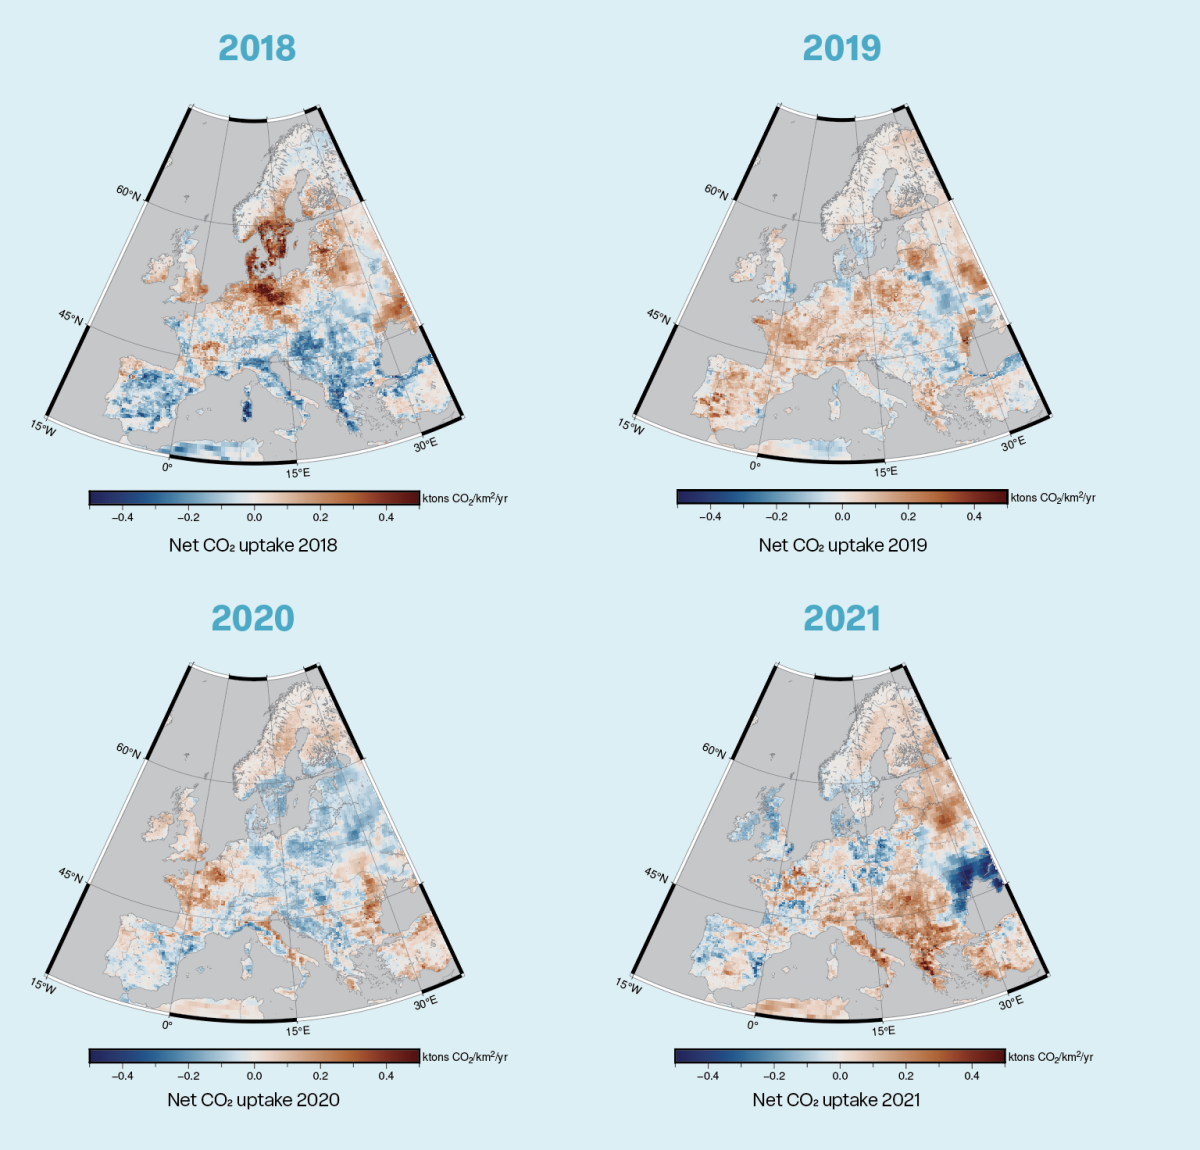
The maps use highly-integrated products based on observations, inventory data and models (hence are not the outcome of one kind of data alone). The colour scales in the maps are different to account for the different magnitude of the fluxes.
The biogenic land ecosystem fluxes (Figure 2) show the net ecosystem exchange (NEE), the balance between photosynthetic uptake of CO2 (gross primary production, GPP) and release of CO2 (total ecosystem respiration, TER). Land ecosystem fluxes over Europe show a complex pattern of regions with regards to net CO2 uptake and release. This pattern changes from year to year with the weather being the main driver of the land fluxes and land management the second most important factor. In regions with net uptake (in blue), the weather has been favourable and no other major disturbances have occurred. Thus, photosynthesis in these ecosystems over the year was higher than the release by respiration. In red regions, unfavourable weather conditions (e.g. droughts) or major disturbances (e.g. excessive forest harvesting) resulted in a net release of CO2. On average, land ecosystems take up about a quarter of the global human-induced CO2 emissions, but the year to year variability is large. Europe reports a land sink through the LULUCF part of the inventories which is currently ~230 Mt CO2e per year for the area of the European Union. However, this number cannot directly be compared to the maps shown here since the lateral fluxes are treated differently in both systems (see article on carbon farming). Nevertheless, these maps include an important message related to the ambition of the EU to increase the land sink: deep red areas symbolising severe droughts (e.g. 2018 in Germany, Denmark and the South of Sweden or 2022 in the Balkan region) have become more frequent and influence the land sink severely.
The maps are based on measurements from ICOS and other sources and models (see references for more information). Lateral fluxes of carbon (harvest, manure) are not considered.
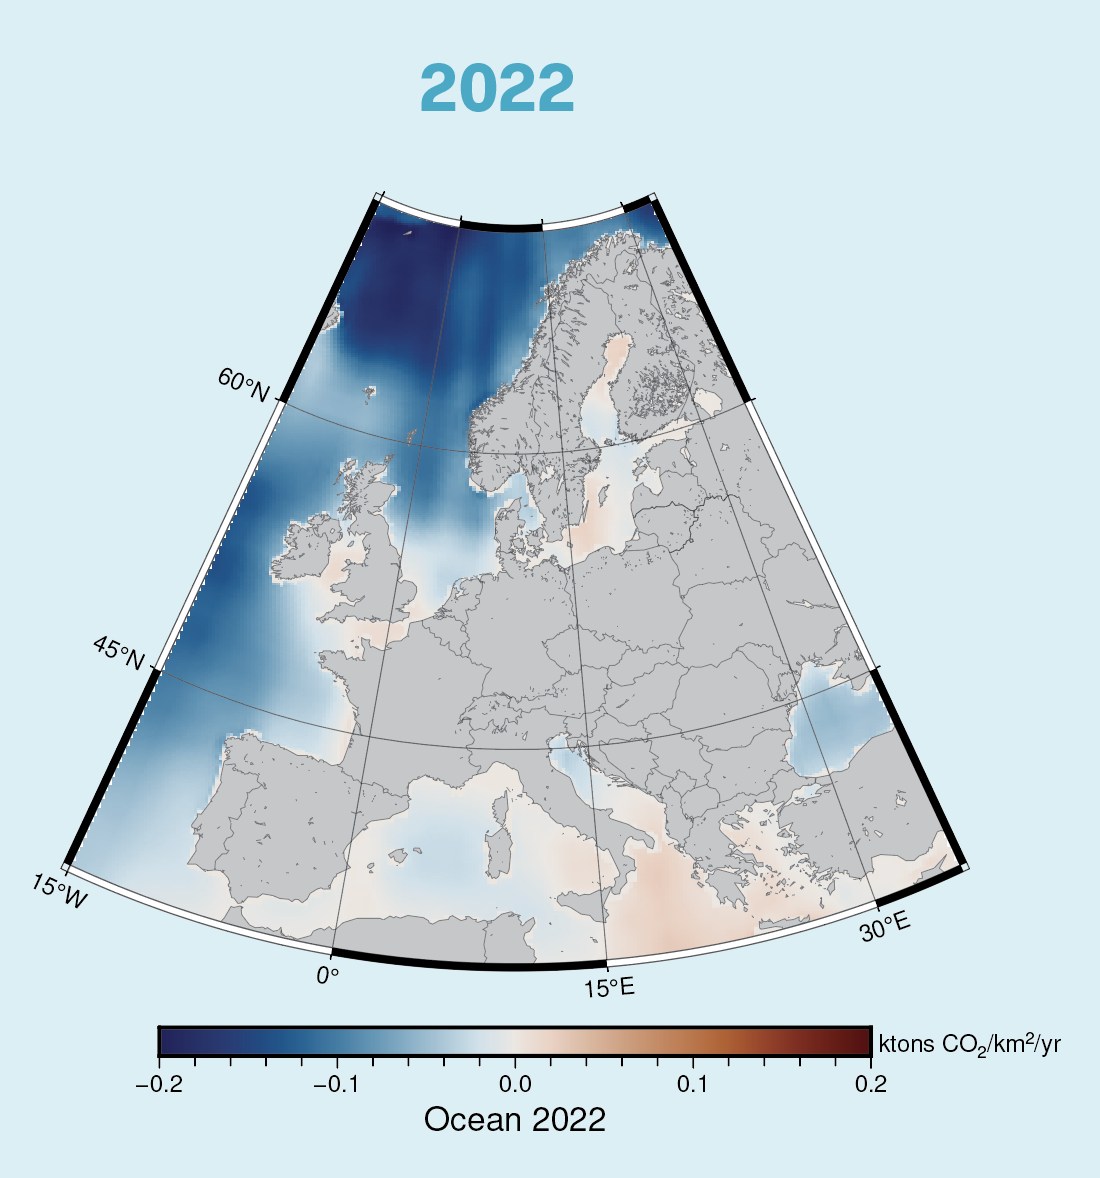
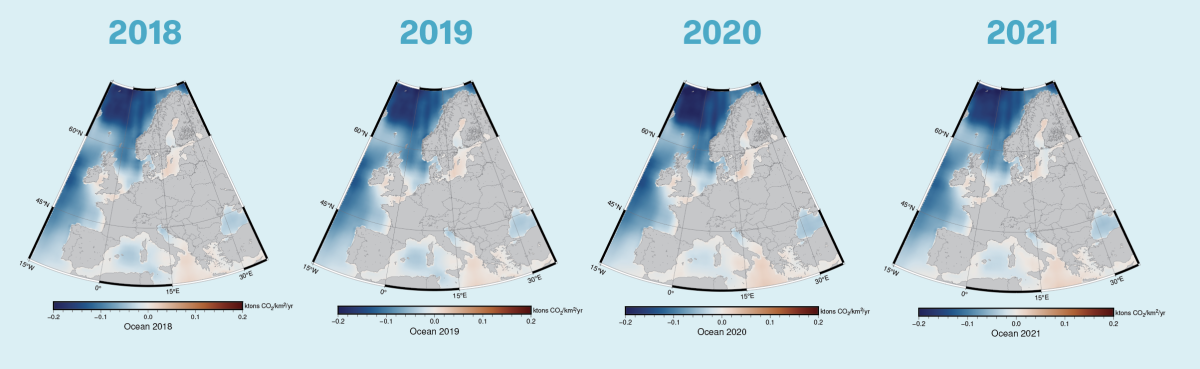
Net carbon dioxide uptake in the ocean
These maps show strong CO2 uptake in the open ocean. Fluxes in the coastal areas, the Baltic Sea, the English Channel, and the Mediterranean Sea show a more complex pattern of sources and sinks. The inter-annual variation is small.
Ocean is a significant sink as it takes up about another quarter of the global CO2 emissions. Ocean fluxes per area are smaller than the land fluxes and vary significantly depending on the region while inter-annual variation is small (Figure 3). They are calculated based on surface ocean measurements of dissolved CO2 which are conducted by ICOS and combined with other observations in the global data base SOCAT (Surface Ocean Carbon Atlas). The biggest differences are seen between the open ocean and coastal regions. Generally, the open ocean takes up CO2 from the atmosphere (in blue), while many coastal regions release CO2 – into the atmosphere (in red). However, proximity to land adds to this complexity and coastal regions can be both sources and sinks.
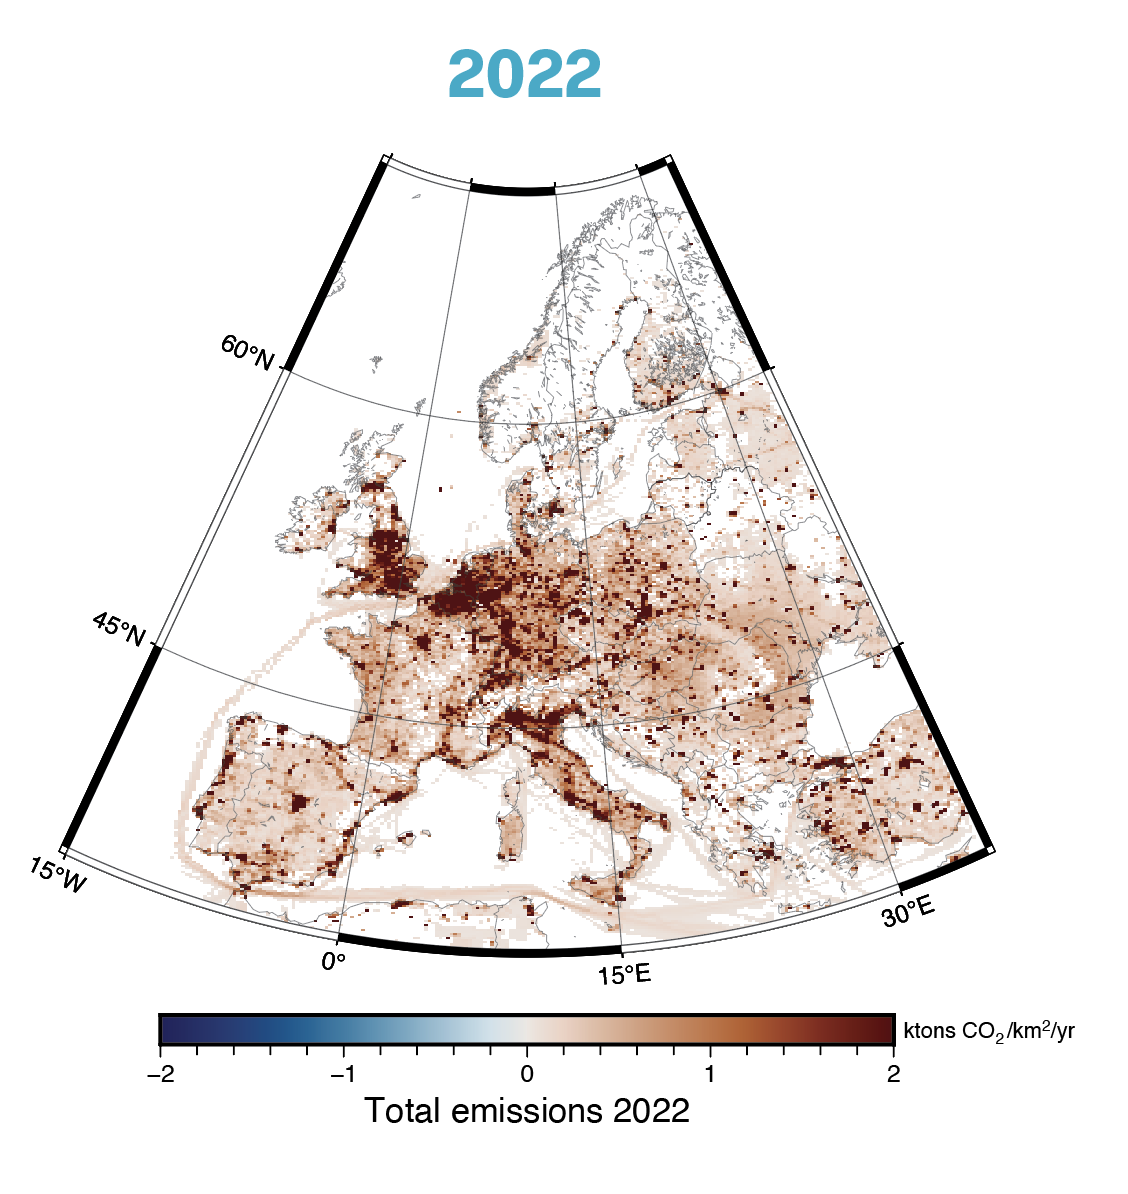
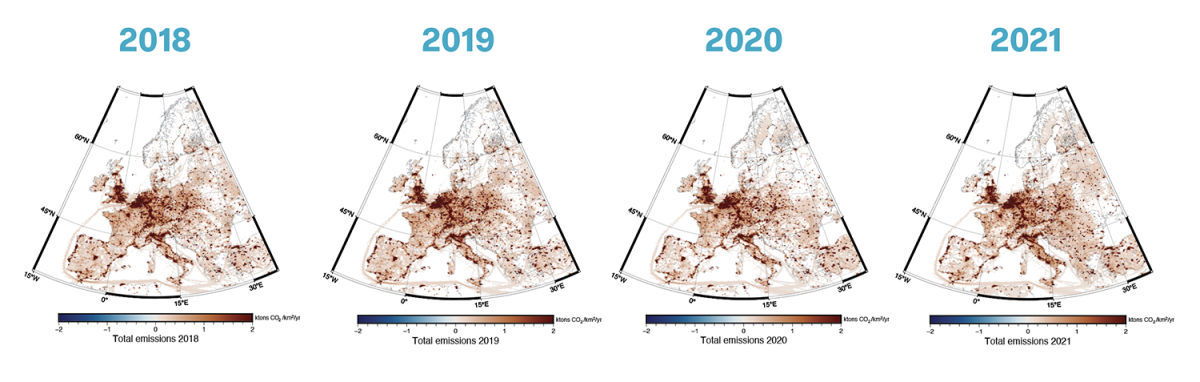
Highest emissions are in industrial areas and highly populated cities.
Carbon dioxide emissions from human activity
CO2 emissions from human activity include contributions from electricity production, industry, households, ground transport, aviation, shipping and cement production. Highest emissions are seen in industrial areas and densely populated cities.
The map of fossil fuel emissions shows only red regions and the scale of the emissions is larger than that of biogenic and ocean fluxes by a factor of 10 (Figure 4). Emissions from marine transport can be seen clearly along major shipping routes.
The figures illustrate that we continue to produce more emissions than terrestrial ecosystems and oceans take up, suggesting that European efforts towards carbon neutrality have not been very effective until 2022 (as reported in FLUXES Vol. 1, 2021). Natural sinks continue to become more vulnerable due to climate change. Thus, the key message in this second volume of FLUXES has not changed: the only way to mitigate climate change is to rapidly reduce fossil fuel emissions.