An ICOS view on carbon fluxes
What we see in the atmosphere can give us useful insights to understand the Earth’s carbon balance and the human role in causing climate change.
Among other tools, scientists can use concentration measurements at tall towers or mountains to observe the atmosphere. The first sustained atmospheric measurements started in 1958 at the remote Hawaiian volcano of Mauna Loa. Comparable measurements like those at Mauna Loa are now carried out worldwide, with a higher density of measurement stations in the northern hemisphere. In Europe, the station density is highest, with, as of March 2023, 46 stations spread across 16 different European ICOS member states and, in total, more than 60 stations all over Europe. With the current long records, these efforts present strong evidence of an undeniable upward trend in CO2 (and other greenhouse gas) levels.
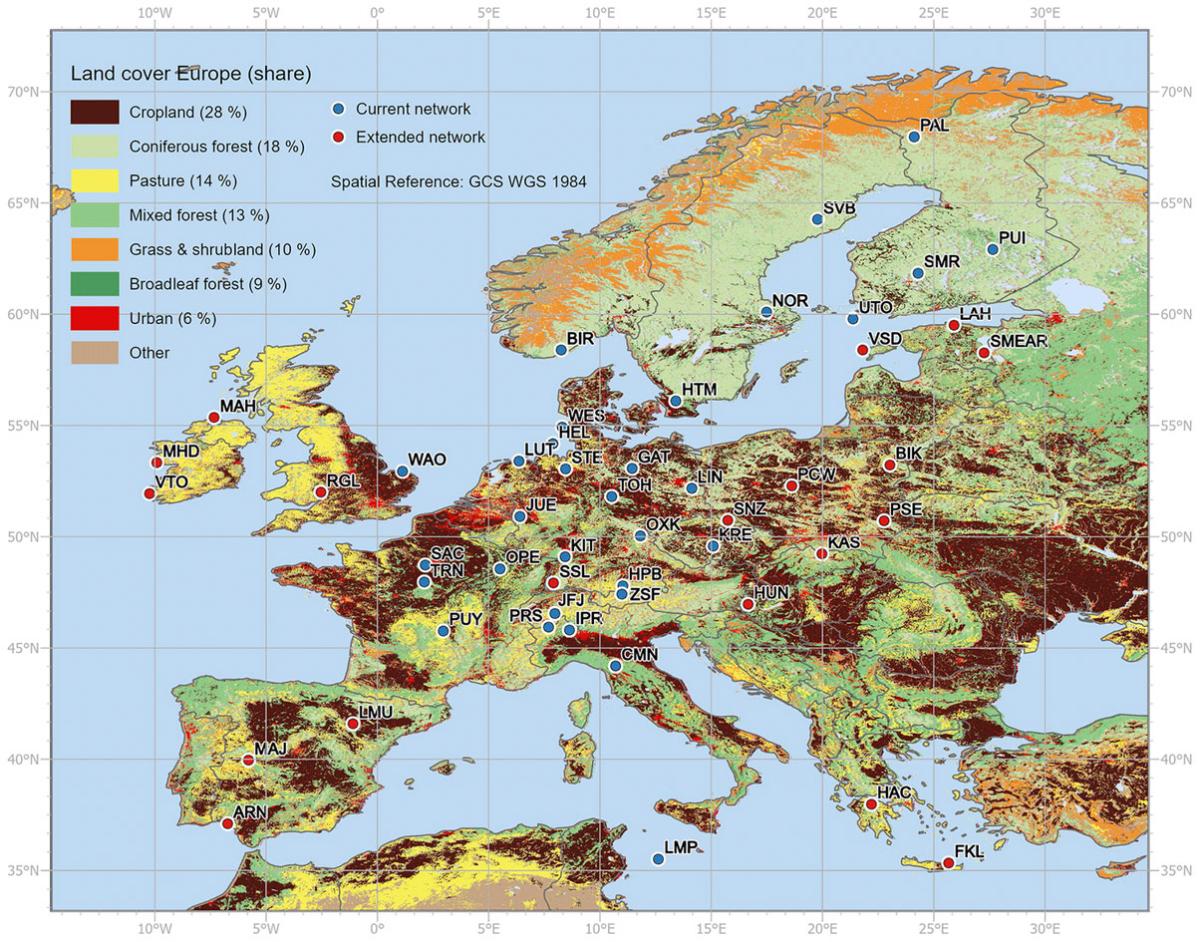
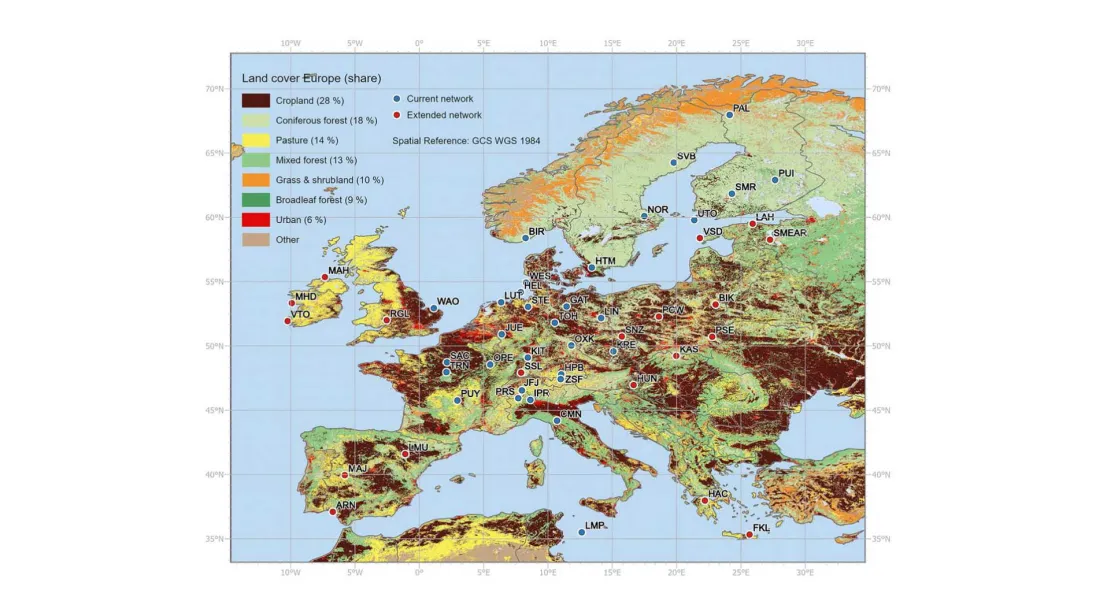
Current (November 2022) and prospective ICOS atmospheric stations within the STILT model domain. Main land-cover types (HILDA; Winkler et al., 2020) and their total shares, given countries contained within the model domain, are shown in the legend.
The stations are unevenly distributed across Europe, bearing implications and consequences on measurements. Ida Storm and her co-authors have explored this impact in their latest paper (https://acp.copernicus.org/articles/23/4993/2023/). She explains, "Measured CO2 concentration is affected by sources and uptake where the air passed before arriving at the station. It is these exchanges we can learn about with the measurements.” They find that exchanges associated with cropland and coniferous forests are relatively better represented than, for instance, those from grass and shrubland. These latter types are more predominant in areas lacking stations, such as Croatia, Serbia, and Albania. The 'relative monitoring potential maps' highlight these regions and aid in identifying potential locations for new stations that could enhance representation.
Ida Storm emphasizes the significance of the term 'relative’. Many ICOS member countries might appear to have limited monitoring potential because they already possess numerous stations compared to the rest of Europe. She clarifies, “This should not be interpreted as indicating no need for new stations in those areas – additional stations are always valuable.” For this reason, they use their methods to analyse individual countries. "Within Germany, exchanges associated with forests are relatively underrepresented and use the maps to show where the highest monitoring potential is." However, she points out that targeting what is underrepresented is not always the goal, as some exchanges may be more important to understand than others.
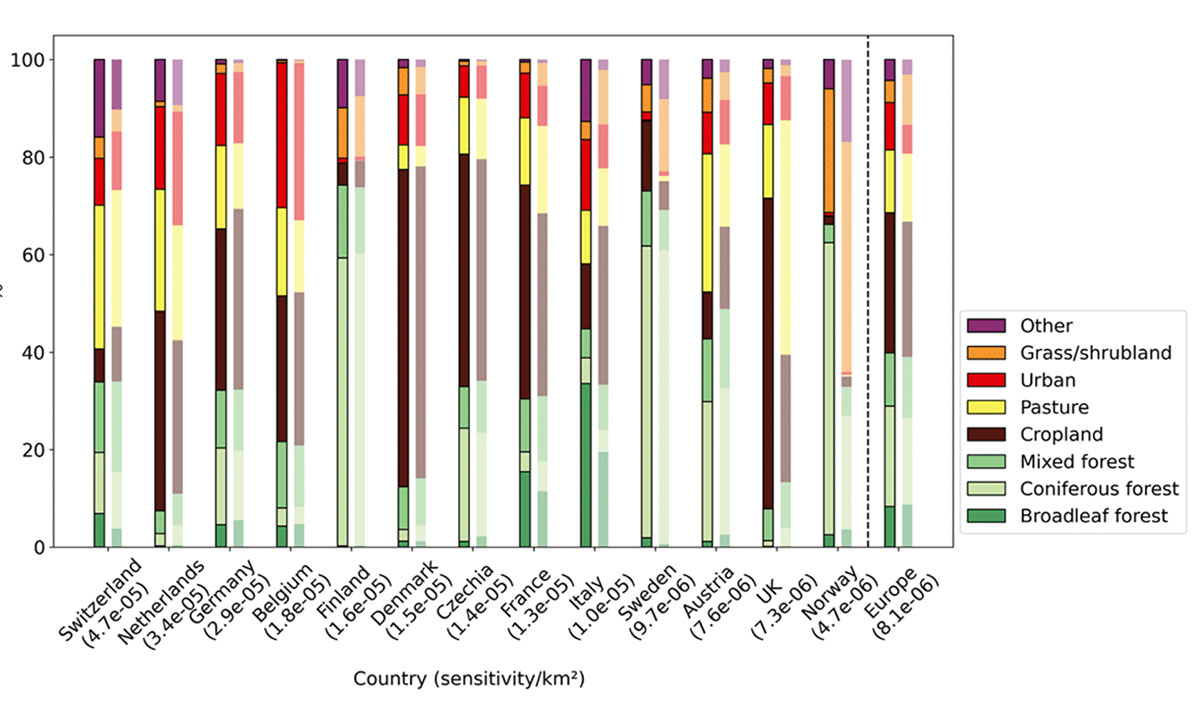
Sensitivity of network land cover (left bars) compared to country shares of land cover (right bars) in ICOS members countries. The graph is sorted from highest to lowest sensitivity per square kilometre (values found in parentheses).
More stations are continuously added to the ICOS network, and the authors could already include 19 planned stations to see how the representation can be expected to change. The extension includes stations in many prospective member countries. The updated monitoring potential maps are relevant for deciding where to place future ICOS stations within these. However, the authors couldn't present results for every European country and exchange type in their paper. Interested readers can use the toolkit provided with the paper to generate these results. They can apply this toolkit to the ICOS network, while advanced users can define hypothetical stations and incorporate them into entirely new networks.
You can dive more into the topic in this ICOS Carbon Portal webinar https://www.icos-cp.eu/cp-webinar.
The webinar introduces the study and includes a segment where Ida Storm demonstrates how to utilize the tools.