ICOS RI Blog - The ocean carbon sink from SOCAT and SOCOM
Dorothee Bakker, Kim Currie, Peter Landschützer, Are Olsen and Christian Rödenbeck on the SOCAT and SOCOM event on 7 September 2015 at the SOLAS Open Science Conference in Kiel, Germany.
Our planet is a blue planet. The oceans cover two thirds of the planet’s surface and play an important role in global climate, biogeochemical cycles and life on the planet. The oceans absorb one quarter of the emissions of the greenhouse gas carbon dioxide (CO2) by human activities, such as fossil fuel burning, cement making and changes in land use. This ocean CO2 uptake slows down climate change, but also results in ocean acidification.
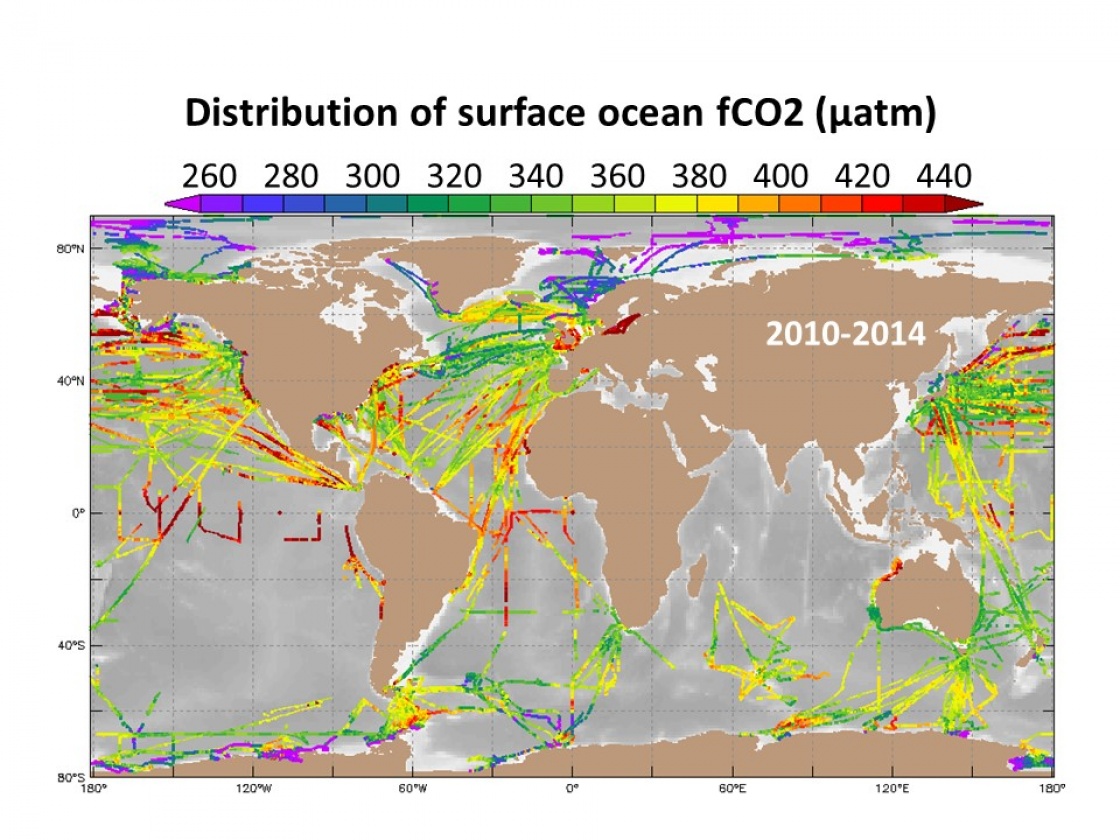
Surface ocean CO2 measurements on ships, moorings and drifters allow us to calculate the amount of CO2 the oceans are taking up. Such seagoing observations were already made in 1957 by Charles Keeling, famous for his time series of accurate measurements of the increasing atmospheric CO2 content since 1953 at Hawaii. In 2007 seagoing carbon scientists from around the world decided to bring together the existing surface ocean CO2 measurements, check their quality and make them publicly available in the Surface Ocean CO2 Atlas (SOCAT, www.socat.info). The scientists were possibly inspired by the imposing surroundings of the Unesco (United Nations Educational, Scientific and Cultural Organization) headquarters in Paris. Now, eight years later, marine carbon scientists have released version 3 of SOCAT. Version 3 has 14.5 million surface ocean CO2 values collected between 1957 and 2014. The observations span the global oceans and coastal seas. The data distribution in SOCAT is uneven with most measurements made in recent decades in the northern hemisphere (Figure 1).
A challenge the SOCOM (Surface Ocean pCO2 Mapping Intercomparison) scientists are addressing is how to fill in the gaps in the observational surface ocean CO2 record in order to estimate the ocean CO2 sink from year to year. SOCOM scientists have concluded that the global ocean carbon sink varies considerably from year to year (Figure 2) and that global ocean carbon models, as used for assessments by the Intergovernmental Panel on Climate Change (IPCC), underestimate this year-to-year variation in the ocean carbon sink.
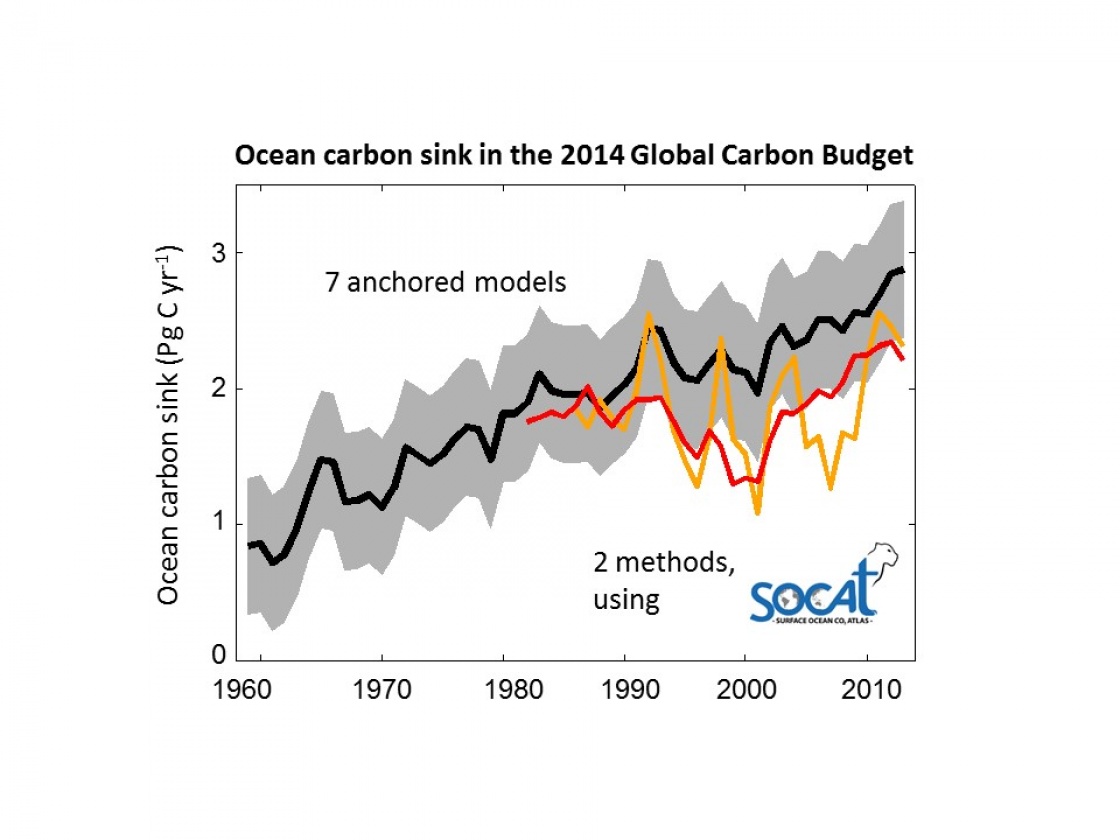
Jointly the SOCAT and SOCOM activities inform the high-profile Global Carbon Budget (Figure 2) and indirectly inform policy makers and climate negotiators on trends and variation in the global ocean carbon sink. SOCAT and SOCOM represent a milestone in research coordination, data access, biogeochemical and climate research and in informing policy. Long-term funding for sustained, high-quality ocean carbon observations and their synthesis is essential for detection of changes in carbon uptake by the vast oceans on our blue planet.
Dorothee C.E. Bakker, Chair of the SOCAT global group and Research Officer in Marine Biogeochemistry
University of East Anglia, Norwich