The Importance of CO₂ Variations for Informed Climate Action
The concentration of carbon dioxide (CO2) in the atmosphere is rising steeply but on top of this trend is an annual variation: CO2 peaks in spring each year and falls to a minimum every summer. This decrease is caused by high net uptake by the European land ecosystems in spring and summer, which removes CO2 from the atmosphere. Further, the annual differences in weather cause year-to-year and regional variations in the uptake of CO2. Fossil fuel emissions also vary in time and space. The ICOS measurements covering Europe detect these changes. To correctly interpret the effects of climate actions taken, we need long-term data showing both the fossil fuel changes and the natural fluxes.
Over decades, atmospheric observations have shown an accelerating trend of increasing CO2 concentration, called the "atmospheric growth rate". The aim of the ICOS Atmosphere Network goes far beyond monitoring this long-term trend in greenhouse gas concentrations. Since the atmosphere is mixed well over the globe within a few months to a year, the atmospheric growth rate is a signal that integrates emissions from all over the world. However, there are seasonal and regional variations in the fluxes that modify the atmospheric greenhouse gas concentration on top of the long-term trend. This information can be analysed on several time scales, mainly revealing daily and seasonal patterns. It is possible to derive information on human-induced emissions as well as on biogenic greenhouse gas fluxes of land ecosystems and of oceans at regional scale. The following analysis provides examples of information directly drawn from atmospheric observations.
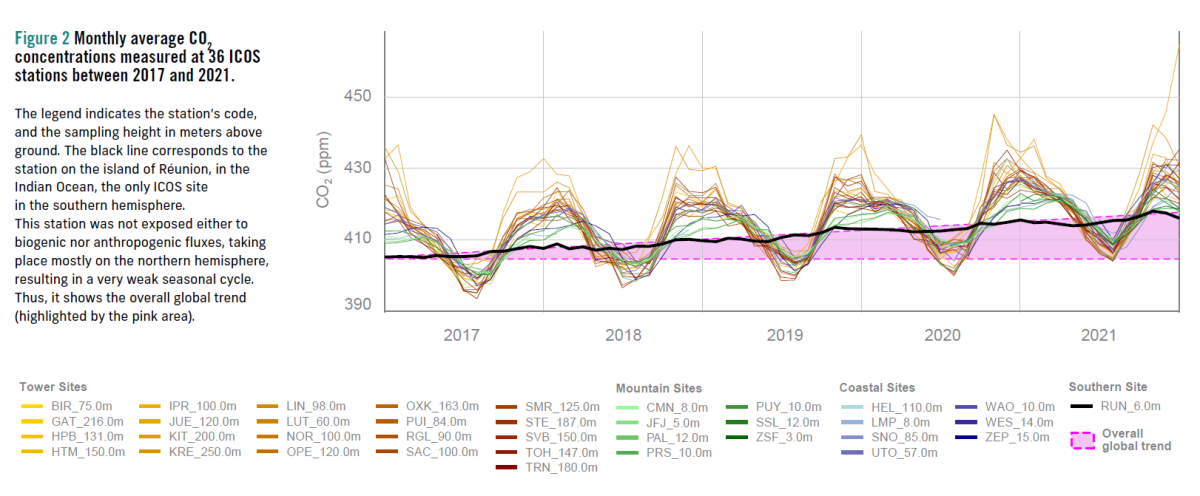
CO2 is measured in ‘parts per million’ (ppm) meaning the number of CO2 molecules in one million air molecules. As shown in Figure 2, all stations show a very similar long-term trend of a 2.3 ppm per year increase over the period 2017-2021. This trend is caused by the global imbalance between CO2 emissions linked to human activities and carbon dioxide removal by oceans and land ecosystems.
This steady increase shows that all attempts to reduce the risks of ongoing climate change, by mitigating CO2 emissions on the global scale have failed so far.
The Importance of Long-Term Observations
While all ICOS stations show a very similar increase in CO2 over the last years, the seasonal cycles show notable differences from station to station (Figure 2). The seasonal amplitudes in Europe are different for mountain sites (amplitude of 11.7±1.3 ppm) and continental and marine sites (amplitude 20.3±2.7 ppm) in particular. The variation results from the difference in exposure of these stations to regional fluxes, and to the seasonal dynamics of atmospheric mixing. The high winter concentrations correspond to the accumulation of CO2 emitted by anthropogenic and land ecosystem sources, exceeding uptake by ecosystems and oceans.
Conversely, the lowest concentrations observed each year in summer result from the absorption of carbon by terrestrial ecosystems. The seasonal decrease in CO2 starts each year in spring when the vegetation in the northern hemisphere becomes a net carbon sink. The case of the Réunion station (RUN in Figure 2) in the Indian Ocean is totally different, since this station is located in the southern hemisphere on an island at more than 2,100 m above the sea level. It is not strongly exposed to natural and anthropogenic fluxes that take place mostly is the northern hemisphere. This explains the very weak seasonal variation (amplitude of 1.5 ppm).
The amount of CO2 in the atmosphere depends on the year-to year changes in the weather and the response of natural sinks to climate change.
The precise continuous measurements from the ICOS network are used to characterise the inter-annual differences in amplitude and phase of the seasonal cycles at each measurement site, as illustrated in Figure 3 for the Torfhaus station located in Germany. Focusing on the period of vegetation growth between April and September, differences can be spotted especially for the years 2018 and 2021 compared to the 5-year average. In 2018 (orange curve), an early drop in CO2 concentration was observed between April and June, but the summer minimum was 15 % above the average. In 2021 (green curve), an opposite signal was recorded, with a slightly later decrease in atmospheric CO2 concentrations, but a more pronounced minimum in August.
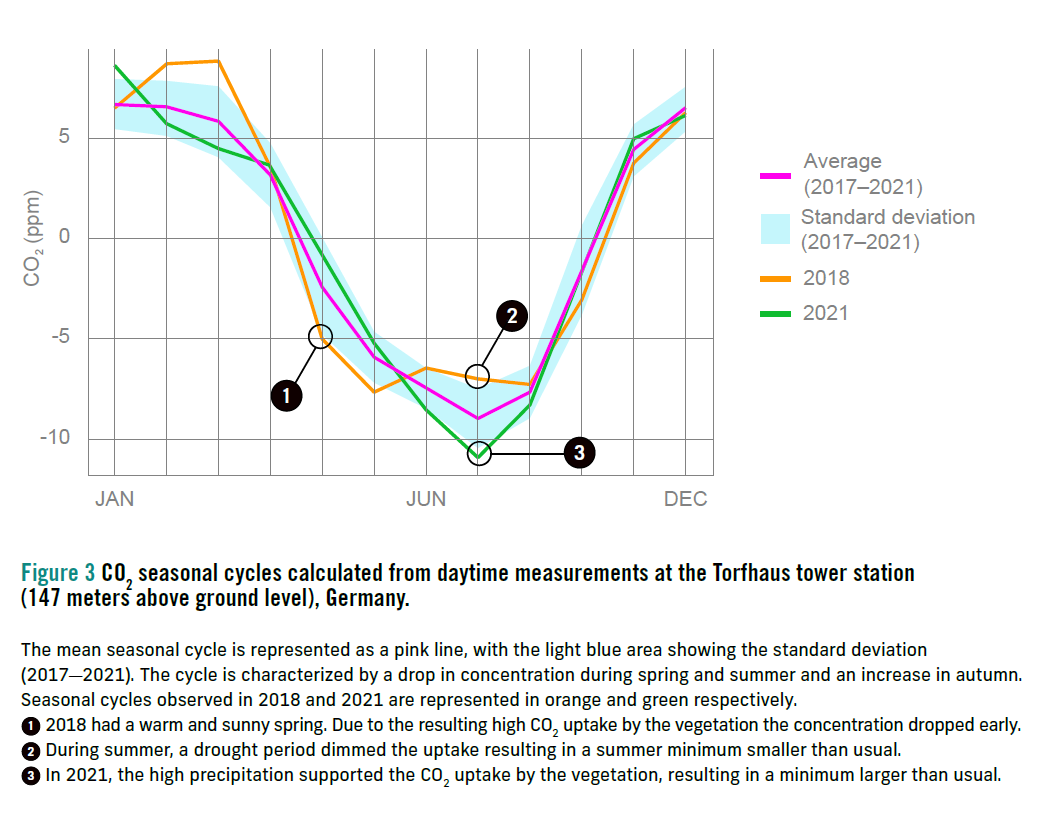
Similar summer anomalies (deviations from the average) have been calculated for all ICOS atmosphere stations by subtracting the mean seasonal concentration in July-August observed in a given year to the same property averaged over the available monitoring period after the long-term trend was removed. In the case of Torfhaus this leads to a summer (July-August) anomaly of +1.3 ppm in 2018, and of -1.2 ppm in 2021. The summer anomalies calculated for all ICOS stations are summarized in Figure 4. It is interesting to note that signals similar to those recorded at the Torfhaus station are found at many stations. The density of the ICOS monitoring network allows for the retrieval of regional patterns regarding the impact of meteorological anomalies on atmospheric CO2 concentrations over Europe.
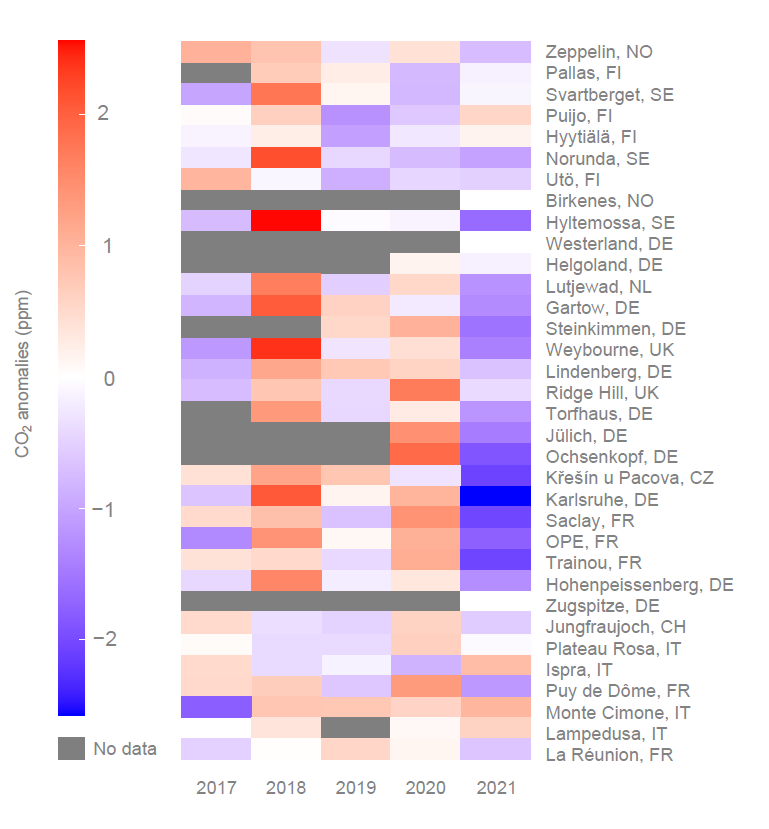
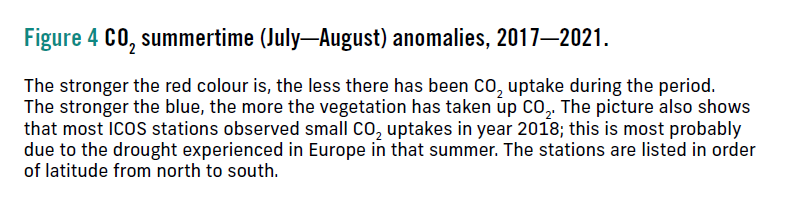
The 2018 anomaly observed in western and northern Europe can be explained by increased productivity due to the warm spring, followed by an extreme summer drought and heat wave, resulting in a decrease in the net productivity of terrestrial ecosystems. The pronounced summer depletion in atmospheric CO2 concentrations during the summer of 2021 resulted most probably from cool and wet conditions over a large part of western Europe, increasing carbon uptake in the ecosystems over this region. The southern Italian atmospheric sites (IPR, CMN, LMP) showed positive CO2 anomalies related to the hot and dry summer conditions affecting Italy in the summer of 2021 and already shown in Figure 1B.
The steep increase of the CO2 concentration in the atmosphere, primarily driven by fossil fuel emissions, is not linear. Seasonal and regional variations in the fluxes modify the signal. The modified signal can be used to identify larger or smaller than normal variations in natural fluxes or changes in human-induced emissions. However, since these fluxes are mixed in the atmosphere, we need to thoroughly interpret these CO2 variations: is it perhaps just dry weather, a particularly warm spring, less traffic, or reduced fossil fuel emissions due to increased renewable energy or a pandemic lockdown? In any case, CO2 variations in the atmosphere contain valuable information for informed, and eventually successful, climate action.