The newly developed Climate Plan Mapper provides city stakeholders with a clear representation of what the future would look like in terms of carbon emissions - if the cities’ climate plans are successfully implemented. The tool also serves as a means to bridge the gap between scientific knowledge and policy implementation.
“It showcases how scientific insights and data can be translated into practical tools for decision-makers in city governance. By providing science-based tools, we empower decision-makers to make informed choices in tackling climate change,” says Junior Researcher Ivonne Albarus, who conducted the study and led the development of the the tool, as a part of the ICOS Cities project.
Cities face several climate change related challenges, also due to limited capacities, both financially and technically. The Climate Plan Mapper demonstrates how cities can leverage available resources effectively by utilizing dynamic tools that are adaptable to local needs.
Multiple forms of usage
The Climate Plan Mapper can be used for a range of different needs:
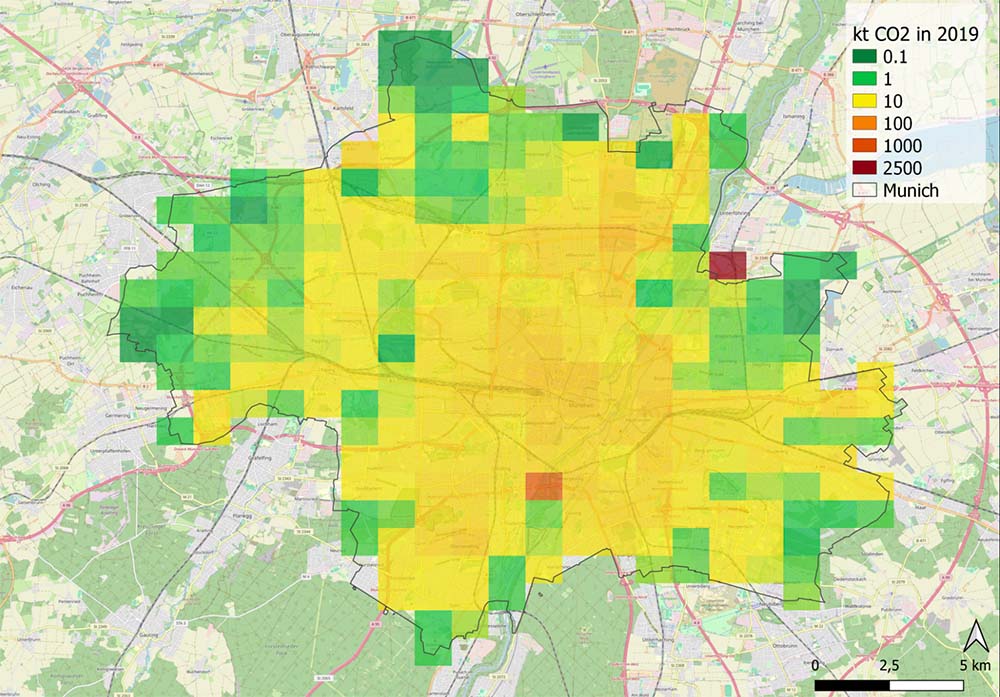
Visual Communication: Maps are powerful tools, that in our case visually represent the city's climate action plans. This visualization can be used to communicate with the general public, stakeholders, and policymakers, enhancing understanding and support for climate initiatives.
Targeted Mitigation Actions: By analyzing the mapped future carbon emissions, cities can identify areas where additional mitigation actions may be necessary or where existing actions can be optimized for greater impact. This targeted approach ensures that resources are allocated efficiently to achieve maximum success.
Policy Support: The tool assists cities in explaining politically sensitive or challenging decisions related to climate action. By providing clear data-driven insights, it helps policymakers justify their choices and garner public support for necessary measures.
Easy to use: The tool's accessibility through the freely available QGIS software and its user-friendly interface makes it easily adoptable. Cities can fill in their planned mitigation actions and receive calculations and visualizations without the need for extensive technical expertise.
A complex process developing the tool
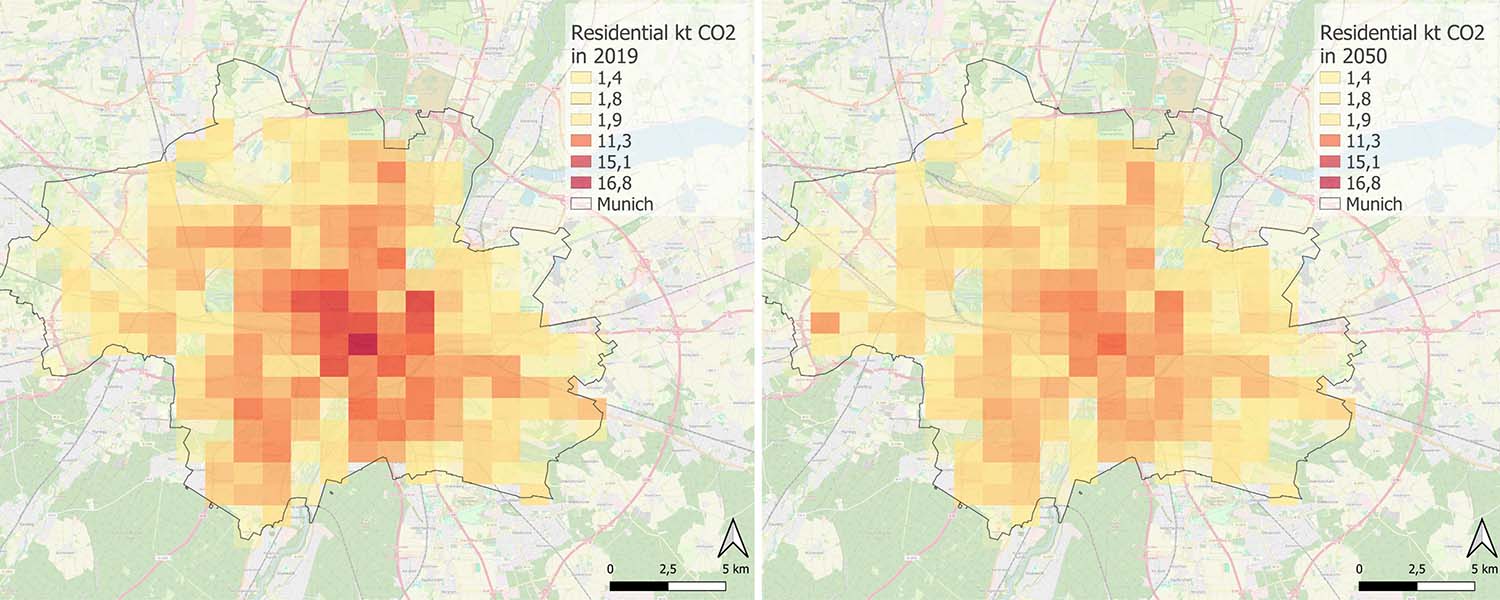
When developing the Climate Plan Mapper, the team started by examining the urban climate plan to assess the carbon impact and duration of mitigation actions across various activity sectors.
“We also conducted an evaluation of the projected population growth over the coming years and included new residential areas in our study. Then, from the spatialized emissions inventory, we subtracted the calculated mitigation actions for each sector.”
The tool is now in use and freely accessible, and anyone can incorporate it to make enhancements of their choice. Albarus sees further opportunities for developing the tool:
”The next steps could involve enhancements and updates by incorporating user feedback, encouraging collaborations maybe within the open-source community for further developments, or exploring opportunities for commercialization to facilitate further expansion, to enlarge distribution, and to assure long-term sustainability and scalability.”
Ivonne Albarus is affiliated with the Laboratory of Climate and Environmental Sciences (LSCE) and Origins.earth, and is part of the ICOS Cities project team. Her PhD research focuses on the intersection of urban climate politics and atmospheric monitoring.
Read more:
Albarus, I., Fleischmann, G., Aigner, P. et al. From political pledges to quantitative mapping of climate mitigation plans: Comparison of two European cities. Carbon Balance Manage 18, 18 (2023): https://doi.org/10.1186/s13021-023-00236-y
ICOS Cities deliverable D1.6: An integrated tool capable of mapping future emissions based on city climate plans and urban development plans
The ICOS Science Conference 2024 offers several urban measurements related sessions such as:
12) Translating Scientific CO2 Emission Research into City Services and 13) In situ data for climate and other environmental services and policy support. Check out the sessions and consider submitting your abstract before 8th April.