New tool available from the ICOS Carbon Portal for visualising potential anomalies in ecosystem variables
The ICOS Carbon Portal is pleased to introduce its latest development on the Carbon Portal JupyterHub: a user-friendly tool for visualizing potential anomalies in ecosystem variables. It was developed by Ida Storm in collaboration with Verena Klasen who was working at the geoinformatics group at Augsburg University at the time. Verena had developed a Python package for visualizing cyclic data and chose ICOS data as a practical example for its application.
The tool focuses on ecosystem sites with measurements dating back to at least 2010, allowing the establishment of reference values that represent what is considered “normal” during the year. Four initial variables have been selected for use in the tool: Gross Primary Production (GPP), ecosystem respiration (RECO), shortwave incoming radiation (SW_IN), and vapor pressure deficit (VPD). GPP and RECO represent the uptake and emission of CO2 by vegetation and soils, while vapor pressure deficit is a measure of how much moisture the air could hold before it becomes saturated and condenses into dew or fog. Data can appear anomalous for various reasons, including unusual weather patterns, crop rotations, or changes in land use.
Intended use-cases for the tool include to:
- visualize the same variable at two sites for the same year.
- visualize the same variable and site for two different years.
- visualize two different variables at the same site and year.
An example of when it is interesting to look at the same variable and site for two different years is when examining vegetation responses during different drought years. At Hainich, situated in a temperate deciduous forest in central Germany, the comparison of GPP during 2018 and 2022 looks like this:
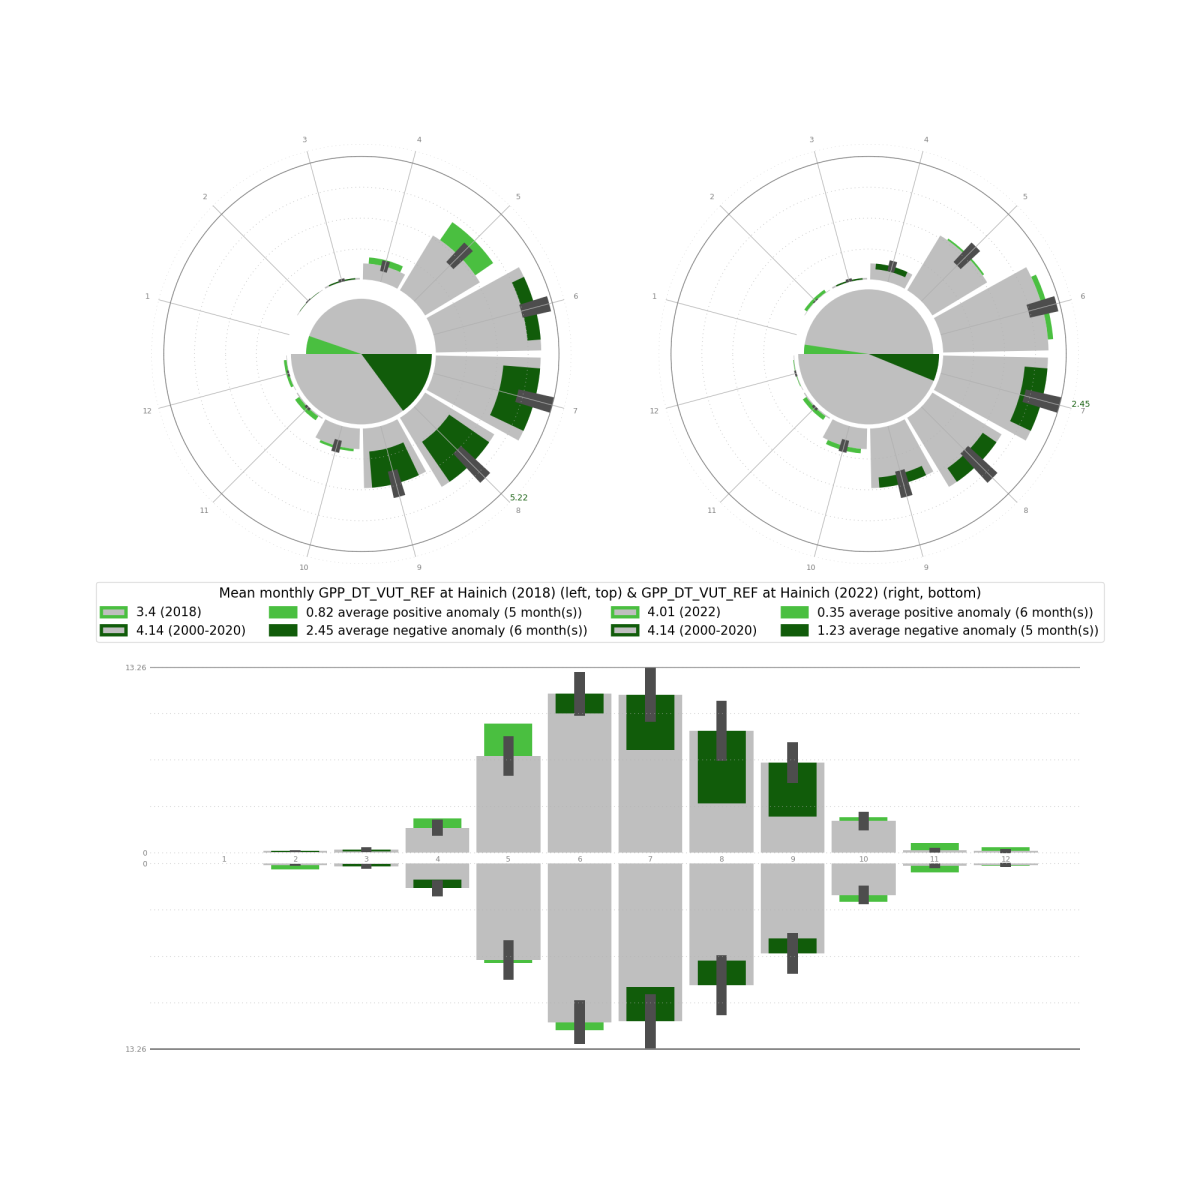
The values are expressed in the unit µmol/m²/s. Dark green indicates monthly averages lower than the references (grey bars; monthly averages for 2000-2020), meaning less uptake of CO2, which is prominent during July, August, and September of both years but especially in 2018. Although the GPP was on average almost the same during 2022 (monthly average about 4.01 µmol/m²/s) as during the reference period (2000-2020 monthly average about 4.14 µmol/m²/s), annual net CO2 uptake (NEP) was even lower in 2022 than for 2018. The reason is that RECO was a bigger source of CO2 during 2022. It was Anne Klosterhalfen, postdoctoral researcher at University of Göttingen and working at Hainich, who highlighted this and provided further insight to what can be seen in the tool: “Both drought years saw higher than normal net radiation and vapor pressure deficit (VPD) values. VPD is linked to water stress and assumed to strongly affect GPP at Hainich (next to low soil moisture).” Users are encouraged to explore this for themselves using the tool.
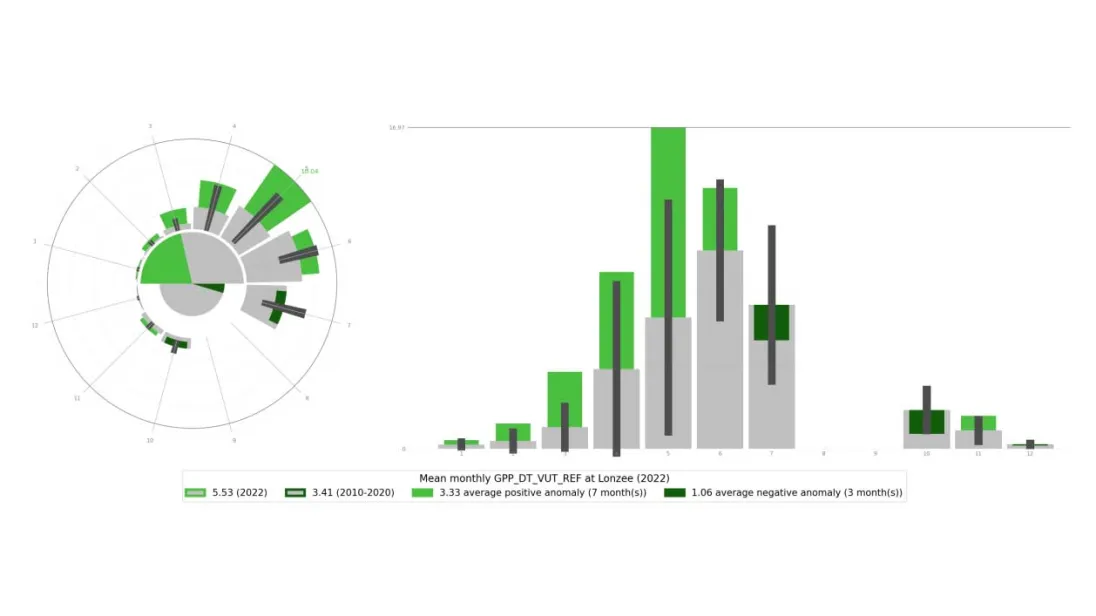
About 400 kilometers east of Hainich, you'll find the Belgian cropland site Lonzée, which also presents interesting results for the year 2022:
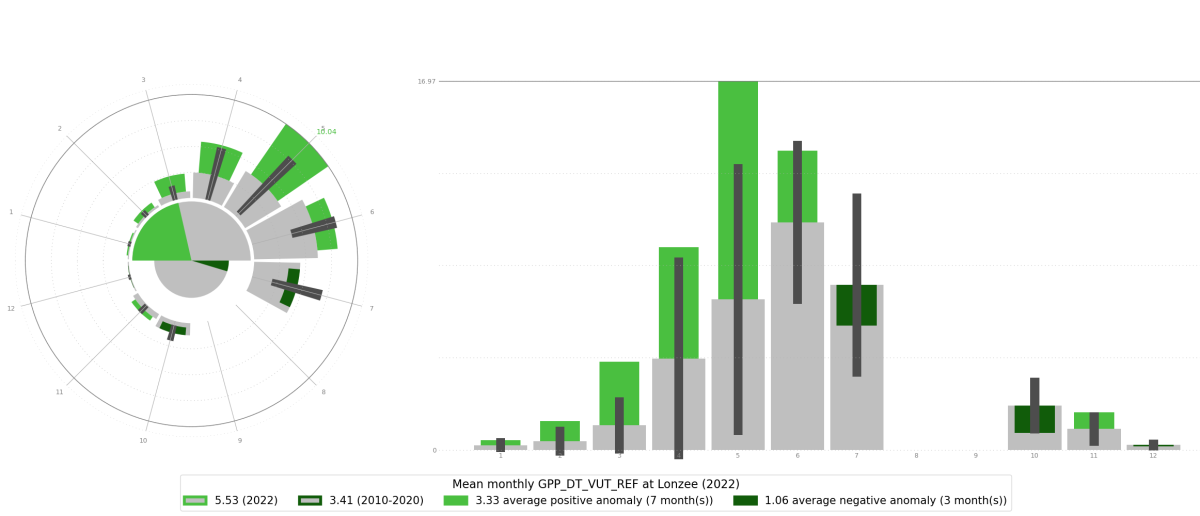
The large standard deviation associated with the monthly averages (dark grey thin bars) during the reference period (grey bars; monthly averages for 2010-2020) indicates that there have historically been large differences in GPP at Lonzée. The site data manager Ariane Faures can provide insight into this: “In the crop rotation, winter wheat is planted every second year and the other years have a bare soil period.” Bare soil conditions result in GPP values of 0 and are the primary reason for the significant “anomalies” observed during the first half of 2022, which was a year with winter wheat. It is a good lesson to learn about the interpretation of the visualizations, and that expert knowledge is many times necessary to complete the picture.
The ICOS Carbon Portal is providing training on the use of the tool on 24 November 2023 at 9.00-9.45 CET. Please register for the webinar using this link or through the button below.
There is also an introduction section in the tool that can help users get started. To do so, please register for an “exploredata” password here. Once you are granted access, this link will take you directly to the notebook.