
Volcanic eruption stopped observations at the Mauna Loa Observatory, but atmospheric CO2 monitoring at global scale went on
The eruption of the Mauna Loa volcano on the island of Hawaii, USA, caused the data series collected by the Mauna Loa Observatory to be temporarily interrupted in November 2022. Despite the eruption, atmospheric CO2 monitoring globally continued. Below is a comparison of data from the Mauna Loa Observatory and the ICOS station Izaña Observatory (IZO), a similar high mountain station in a subtropical region, which helped to fill the observation gap while Mauna Loa was out of operation.
This article was provided for publication by ICOS Spain in late December 2022 and authored by E. Cuevas, P.P. Rivas, O.E. García, R. Ramos and S.F. León-Luis. For questions, please contact ecuevasa@aemet.es.
The eruption of the Mauna Loa volcano on the island of Hawaii (USA) has forced the interruption of the activity of the world's most important observatory for monitoring atmospheric composition. The Mauna Loa Observatory (MLO) holds the world's longest record of surface atmospheric carbon dioxide (CO2) measurements. In March 1958, C. David Keeling of the Scripps Institution of Oceanography (https://scripps.ucsd.edu/) implemented the CO2 observing program at a National Oceanic and Atmospheric Administration (NOAA) facility [1]. In May 1974, NOAA started its own CO2 measurement program and since then both observing programs have been operating in parallel [2,3]. The graph that shows the evolution of the CO2 concentration in MLO since 1958 is known as the Keeling curve.
Although the ongoing volcanic eruption at Mauna Loa has caused the MLO data series to be temporarily interrupted since November 29, atmospheric CO2 monitoring has not been interrupted. NOAA itself, apart from Mauna Loa, manages three other continuous CO2 measurement stations under background conditions (Barrow-Alaska; American-Samoa; and South Pole-Antarctica). Together with the University of Hawaii, NOAA also established a temporary measurement site at the nearby Mauna Kea volcano for the critical CO2 record and other atmospheric measurements. On a global scale, more than a hundred stations currently measure CO2 in sites representative of very different environmental conditions and climates, contributing to the Global Atmosphere Watch (GAW) Program of the World Meteorological Organization (WMO). Moreover, Europe manages the Integrated Carbon Observation System (ICOS) research infrastructure whose network of 155 stations monitors CO2 and other gases in the atmosphere, oceans and major ecosystems.
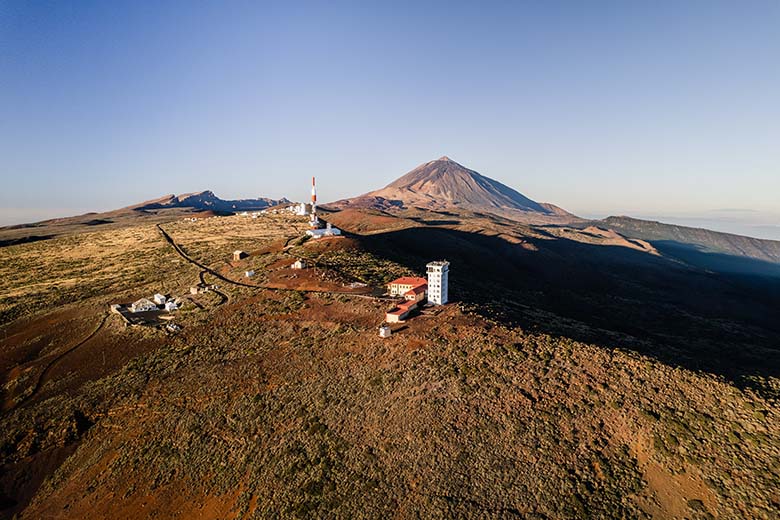
As an example, and to show that the information on CO2 concentrations in the atmosphere provided by Mauna Loa is also provided by other stations, below we compare the CO2 concentration data recorded at MLO and at the Izaña Observatory (IZO) from 1984. IZO is managed by the State Meteorological Agency (AEMET) through the Izaña Atmospheric Research Center. IZO began its atmospheric CO2 concentration measurement program in 1984, largely by replicating the CO2 measurement program established at Mauna Loa. In fact, the German researchers who, a decade earlier, had proposed Izaña as a station for the Background Atmospheric Pollution Monitoring Network (BAPMoN) referred to Izaña as the “European Mauna-Loa”. IZO has contributed to the Global Atmosphere Watch (GAW) Program of the World Meteorological Organization (WMO) since 1989, the year this network was created, but also to the NOAA CO2 database (ObsPack CO2 Data).
IZO and MLO are part of a small group of high mountain stations that are representative of background conditions, and specifically of the subtropical region. The background stations are located in sites not directly affected by anthropogenic pollution sources, and one of their main objectives is to measure, very precisely, long-term changes in atmospheric components. MLO and IZO share a series of common characteristics such as being located in high mountains, on islands sufficiently far from anthropogenic pollution, and located at a similar latitude. This type of station ensures that, for many hours a day, CO2 measurements are carried out under background conditions, corresponding to almost pure free troposphere. When the average monthly CO2 concentrations of both stations, separated from each other by more than 13,000 km, are compared, it is observed how their data practically overlaps (Figure 1). This is only possible if both stations are measuring very clean air masses, normally coming from the middle layers of the troposphere, and the fact that CO2 has a very long life, which allows it to mix well throughout the atmosphere.
The monthly series of IZO and MLO reproduce in the same way the seasonal variation of CO2 associated with the respiration cycle of the vegetation in the northern hemisphere. So, the annual CO2 maximum in spring, between the end of April and the beginning of May. However, it must be said that the amplitude of the seasonal CO2 cycle is slightly different in both observatories, as shown in the zoomed detail of Figure 1. IZO presents a slightly greater seasonal amplitude than MLO because it is located about 8° latitude further north (there is a latitudinal gradient with higher CO2 concentration at higher latitudes), and at a shorter distance than MLO from continental regions, so IZO measurements would be slightly more affected by the photosynthetic activity of plants. Instead, MLO located in the middle of the Pacific Ocean is less affected by this natural cycle of CO2.
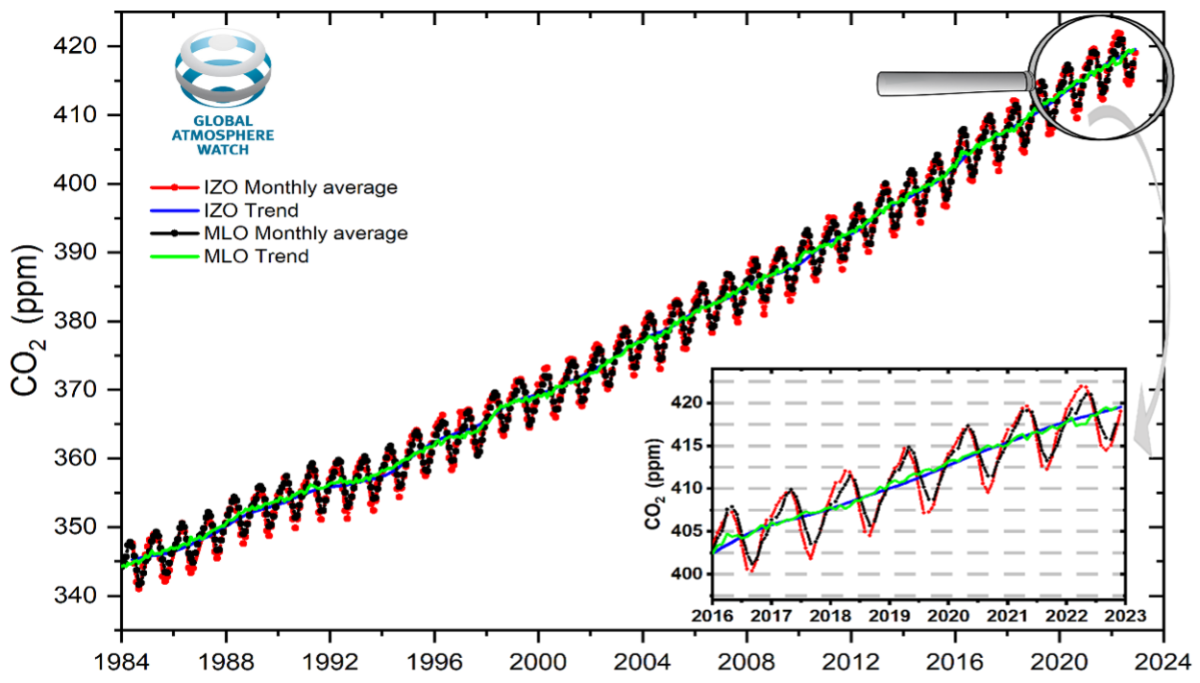
Although the natural seasonal cycle in the two stations is slightly different, the fitting curves of the deseasonalized data series for both stations overlap as shown in Figure 1. These rising CO2 curves represent the anthropogenic component of atmospheric CO2, that is, the observed increase in CO2 from year to year is due to CO2 emissions into the atmosphere from fossil fuels burning. Both stations show the same mean annual increase in background CO2 concentration, confirming that this process occurs on a global scale.
Table 1 shows the mean annual increases in CO2 evaluated in different periods of time. Both stations indicate, in almost the same way, how the accumulation of CO2 in the atmosphere is accelerating. If in the 1980s the average annual increase in the background concentration of CO2 was approximately 1.3 ppm/year, it is currently somewhat higher than 2.5 ppm/year. In other words, the rate of increase of CO2 grows an average of 1 ppm/year every 25 years approximately.
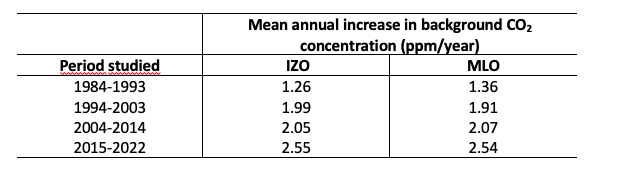
This means that international commitments to reduce CO2 emissions have not been met, registering an increase in CO2 and other greenhouse gas emissions globally. Even if CO2 emissions were to stabilize or decrease, it would take quite a long time to register a change in the trend of atmospheric CO2 concentration.
IZO and MLO are part of the Global Atmosphere Watch (GAW) Program of the World Meteorological Organization (WMO). In January 2021, Spain officially joined the European research infrastructure Integrated Carbon Observation System (ICOS), where IZO was proposed as the first atmospheric station of the Spanish node. The national network, ICOS-Spain, is in a process of growth and, for this, it has incorporated the atmospheric station of El Arenosillo-Huelva (INTA) into its network in 2022. In 2023 the ecosystem station of Majadas de Tiétar and the oceanic station ESTOC will be incorporated.
References:
[1] Keeling, C.D., Bacastow, R.B., Bainbridge, A.E., Ekdahl, C.A., Jr., Guenther, P.R., Waterman, L.S. and Chin, J.F.S. (1976), Atmospheric carbon dioxide variations at Mauna Loa Observatory, Hawaii. Tellus, 28: 538-551. https://doi.org/10.1111/j.2153-3490.1976.tb00701.x
[2] Thoning, K. W., P. P. Tans and W.D. Komhyr, (1989), Atmospheric Carbon Dioxide at Mauna Loa Observatory 2. Analysis of the NOAA GMCC Data, 1974-1985, Journal of Geophysical Research-Atmospheres, 94, D6, 8549-8565, JD094iD06p0854