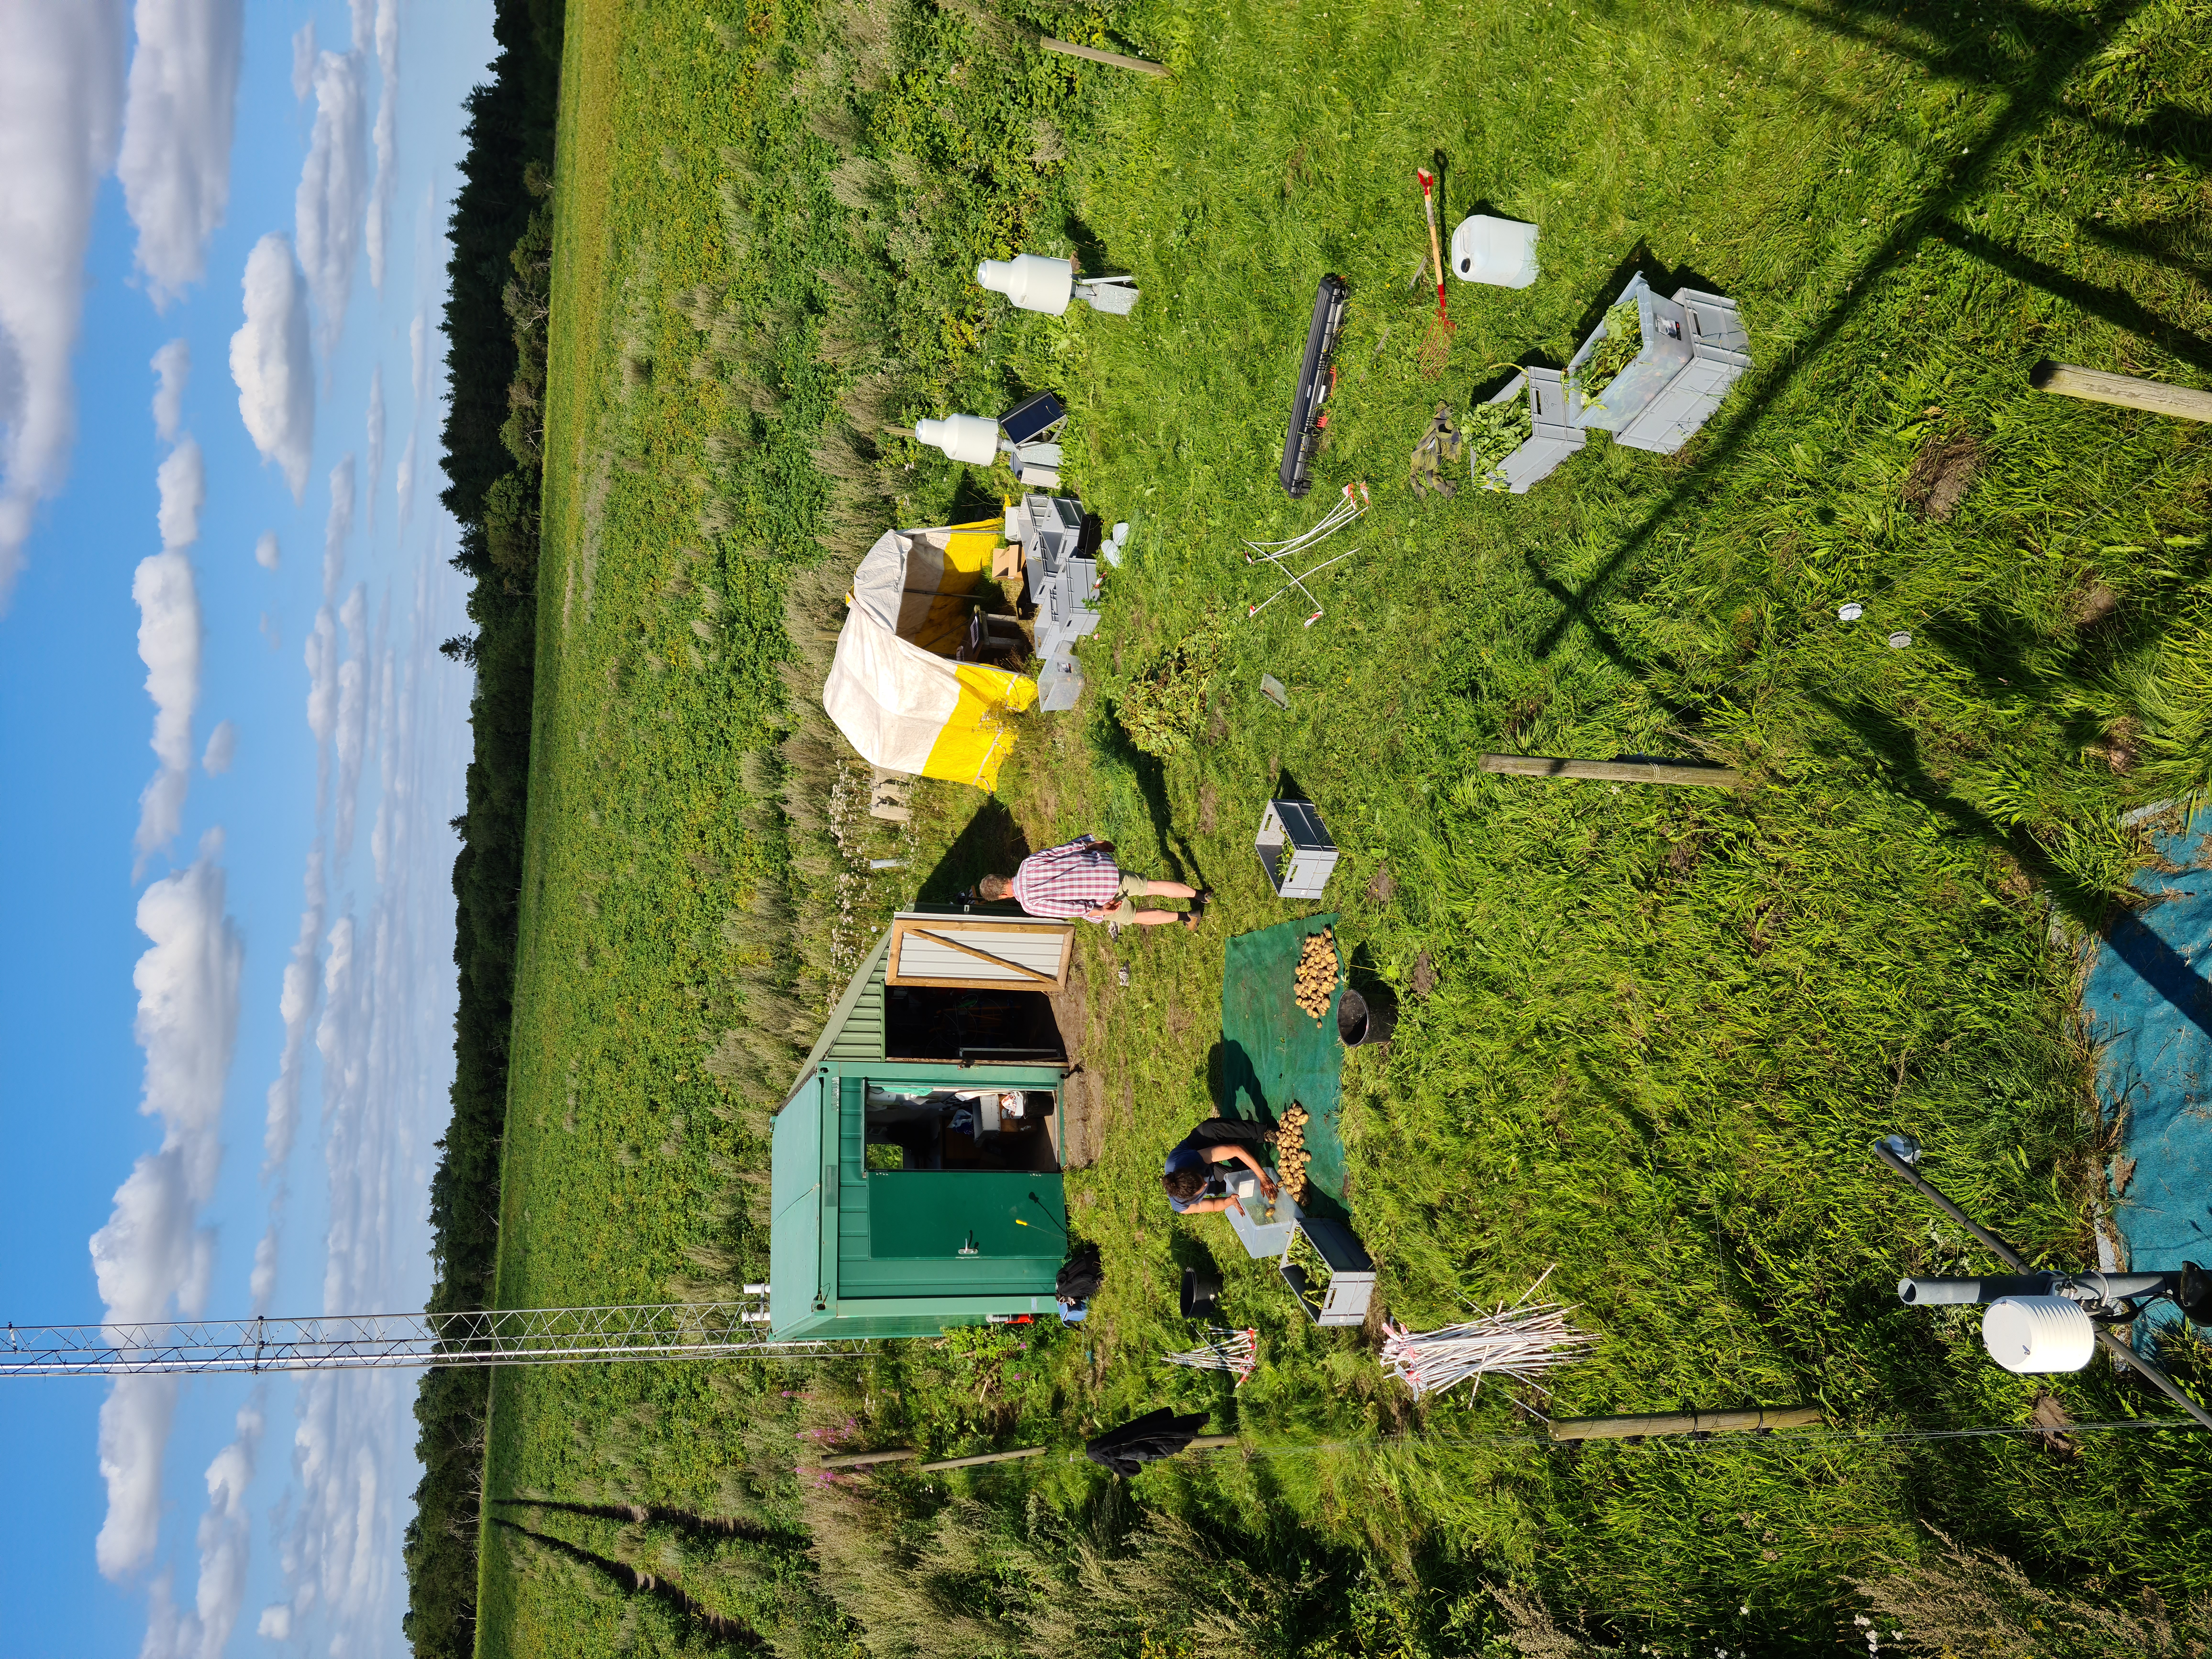
The Voulundgaard ICOS Ecosystem station in Denmark lies in a cropland located in the Eastern part of the Skjern River catchment. The station is situated in an intensely cultivated area, as is around 60-70% of Denmark. The station manager Rasmus Jensen is in charge of organising the fieldwork and making sure the station equipment is running as planned and producing quality data. One of his main tasks is planning the fieldwork for the summers.
“It’s kind of a dream job. Other than working in the field, I do a lot of data analysis and keep in contact with people that are needed in the field.”
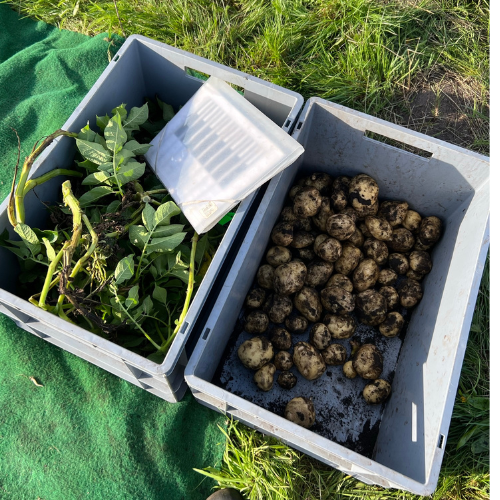
The farmer of the field follows a somewhat standard practice in agriculture called crop rotation, where the type of crop changes every year. This makes the job of a researcher interesting: since receiving its ICOS label in 2020, the station has gained experience in doing fieldwork with barley and potatoes. Careful planning is at the core of fieldwork.
“We have a very tight plan for fieldwork. We have to have good schemes to keep track of all sampling.”

Working with standardised fieldwork methods
The Voulundgaard station is working with eddy covariance measurements that observe the exchanges of gas, energy, and momentum between ecosystems and the atmosphere. The method is combined with destructive sampling, where the whole plant is dug up from the ground, dried and measured to define the above-ground biomass. This method, of course, requires a lot of manual work in the field.
As a Class 1 ICOS Ecosystem station, the staff at Voulundgaard has to follow a set of rigorously standardised protocols developed for field measurements. In their case, the fieldwork protocols call for 24 sampling points in pre-defined areas in the field. Four of these points are called continuous measuring plots, meaning they are sampled almost every week during the growing season. The other 20, which are called sparse measuring plots, are sampled right before the harvest. Every plot gets sampled twice, adding up to 48 sampling points. But why do you need two different time series?
“These points should reflect the variability within the whole field. We check that the magnitude and variability of the four continuous measuring plots is comparable to the 20 sparse measuring plots”, Jensen explains. “It is a way to be able to both describe the temporal development of crops and the spatial distribution, without having to sample the whole field every time.
The fieldwork protocols defined by ICOS are a strong backbone for fieldwork. The instructions for ecosystem stations are written by ICOS Ecosystem Thematic Centre.
“The rules don’t leave much room for interpretation – the only thing we had to invent ourselves with was how to dry the 150 kgs of potatoes in the lab”, Jensen smiles. “The clear rules make comparing the samples more reliable.”
New measurement methods
The mind of a researcher is always looking for gaps in science. Just by spending time on the field, the staff have already been able to see structural differences in terms of vegetation height, or see areas that have limited growth due to the plants not having enough fertilisation or available soil water. This sparked the idea to try and measure the variation scientifically through indirect methods.
“For the past years we have worked on spatial variation” Jensen explains. “We have a PhD student estimate biomass through drones and create models for it. The results were published in our recent article. We want to work further with that, to incorporate the ICOS data from flux measurements and destructive sampling.”
The data from Voulundgaard travels through the ICOS Ecosystem Thematic Centre to the ICOS Carbon Portal, where it can be used in different fields, models and carbon accounting. Jensen is particularly driven by providing data on the greenhouse gas emissions of the agricultural sector to local decision-makers.
“National carbon budgets are very rough estimates that contain no actual data. We can provide decision-makers with actual datasets that contain data on spatial and yearly variability. There’s a big potential in using this data even more.”
Editorial note: At the time of publishing this (21.12.2022), the recent government change in Denmark has slowed down the decision-making concerning the funding of the ICOS stations in the country from 2023 onwards. The long-term value of greenhouse gas observations should be acknowledged by all countries. If you do not measure one day, that data is lost forever, as you can never redo that period of time again. This was well proved by the ICOS observations on the NorthStream leaks on the Baltic Sea quite close to Denmark. Follow the Voulundgaard station on Twitter for more updates.
Explore data from Voulundgaard station
Read a research paper Jensen, R., Herbst, M., & Friborg, T. (2017). Direct and indirect controls of the interannual variability in atmospheric CO2 exchange of three contrasting ecosystems in Denmark. Agricultural and Forest Meteorology, 233, 12-31.