Disclaimer
These files are updated with the latest data on a monthly basis with a delay of 2-3 months. So for example the latest data for July of a year will be added to the collection in October of the same year.
The total collection contains >300 monthly files the data volume and is more than 1 TB. It can be downloaded by pressing the download button for the main collection, but we advise to download only those file for source categories and months that you actually need by digging deeper into the collection per year, month and finally emission category.
The dataset is documented in:
van der Woude, A. M., de Kok, R., Smith, N., Luijkx, I. T., Botía, S., Karstens, U., Kooijmans, L. M. J., Koren, G., Meijer, H. A. J., Steeneveld, G.-J., Storm, I., Super, I., Scheeren, H. A., Vermeulen, A., and Peters, W.: Near-real-time CO2 fluxes from CarbonTracker Europe for high-resolution atmospheric modeling, Earth Syst. Sci. Data, 15, 579–605, https://doi.org/10.5194/essd-15-579-2023, 2023.
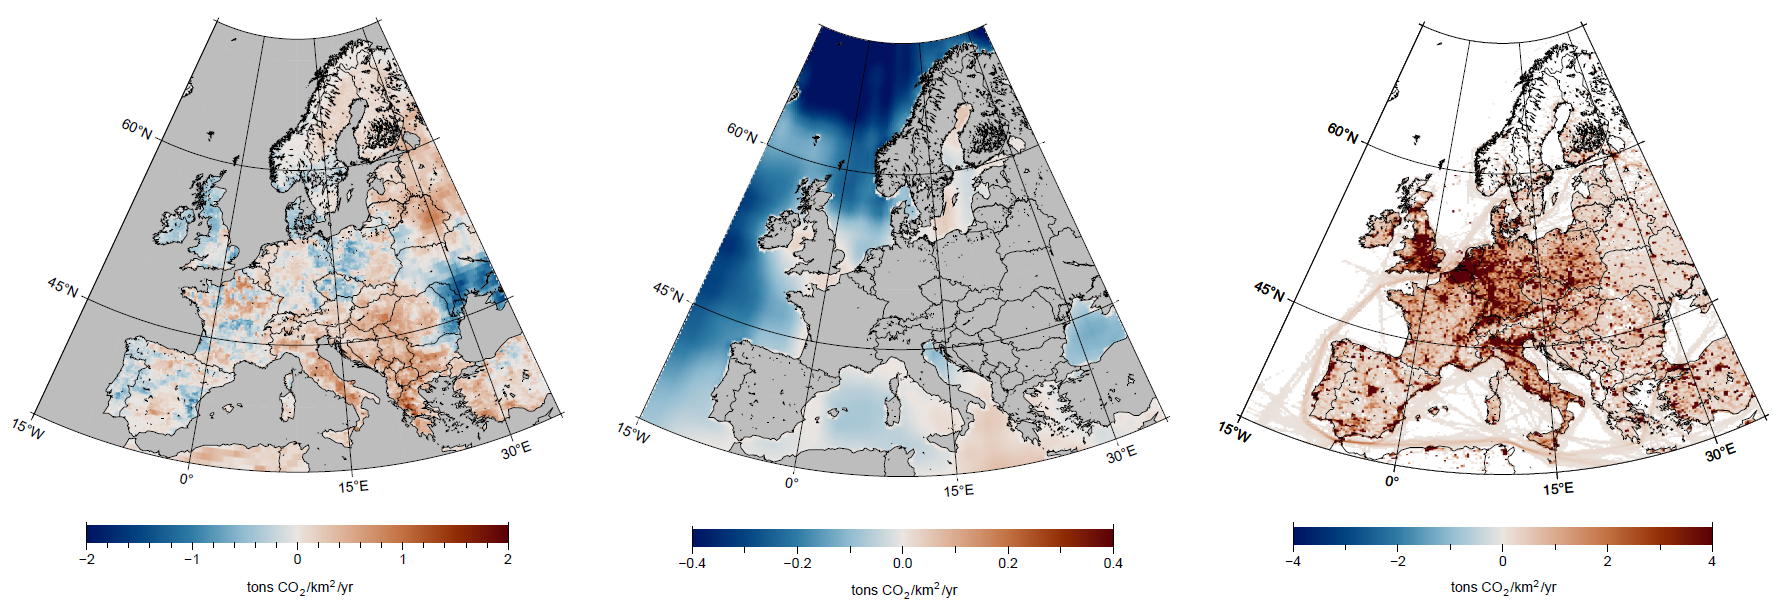
Collection of hourly CO2 fluxes for 2017-2024, format is cf-1.7 compliant netcdf, containing hourly estimates of biospheric fluxes, anthropogenic emissions (total and per sector), GFAS fire emissions and Jena CarboScope ocean fluxes, all re-gridded to match the resolution of the biospheric fluxes. Net ecosystem productivity (gross primary production minus respiration). Positive fluxes are emissions, negative mean uptake. These fluxes are the result of the SiB4 (Version 4.2-COS, hash 1e29b25, https://doi.org/10.1029/2018MS001540) biosphere model, driven by ERA5 reanalysis data at a 0.5x0.5 degree resolution. The NEP per plant functional type are distributed according to the high resolution CORINE land-use map (https://land.copernicus.eu/pan-european/corine-land-cover), and aggregated to CTE-HR resolution. Anthropogenic emissions include contributions from public power, industry, households, ground transport, aviation, shipping, and calcination of cement. Our product does not include carbonation of cement and human respiration. Public power is based on ENTSO-E data (https://transparency.entsoe.eu/), Industry, Ground transport, Aviation, and Shipping is based on Eurostat data (https://ec.europa.eu/eurostat/databrowser/). Household emissions are based on a degree-day model, driven by ERA5 reanalysis data. Spatial distributions of the emissions are based on CAMS data (https://doi.org/10.5194/essd-14-491-2022). Cement emissions are taken from GridFED V.2021.3 (https://zenodo.org/record/5956612#.YoTmvZNBy9F). GFAS fire emissions (https://doi.org/10.5194/acp-18-5359-2018), re-gridded to match the resolution of the biosphere, fossil fuel, and ocean fluxes of the CTE-HR product. Please always cite the original GFAS data when using this file, and use the original data when only fire emissions are required. For more information, see https://doi.org/10.5281/zenodo.6477331 Contains modified Copernicus Atmosphere Monitoring Service Information [2020]. Ocean fluxes, based on a climatology of Jena CarboScope fluxes (https://doi.org/10.17871/CarboScope-oc_v2020, https://doi.org/10.5194/os-9-193-2013). An adjustment, based on windspeed and temperature, is applied to obtain hourly fluxes at the CTE-HR resolution. Positive fluxes are emissions and negative fluxes indicate uptake. Please always cite the original Jena CarboScope data when using this file, and use the original data when only low resolution ocean fluxes are required. For more information, see https://doi.org/10.5281/zenodo.6477331