
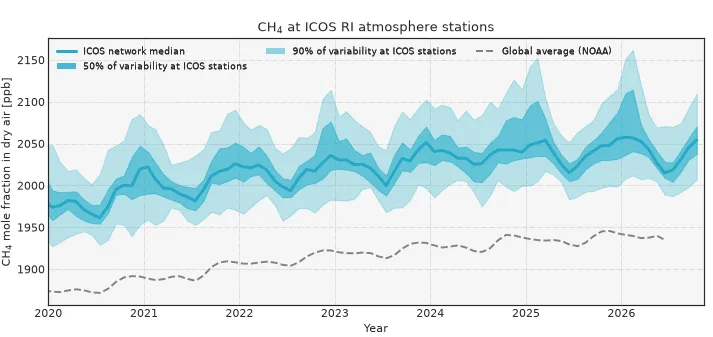
Growth of methane in Europe’s atmosphere slowed sharply in 2025, ICOS Methane Curve shows
ICOS launches the ICOS Methane Curve, a tool that tracks methane in the European atmosphere and is updated daily. As soon as a month ends, it reports the median methane concentration for Europe for that month. For the year 2025 and for the last 12 months, the European methane levels have risen at only a third of the pace seen for the previous decade. The Methane Curve helps track the effectiveness of climate actions, such as the Global Methane Pledge.
Today, the governments and partners convene in their Global Methane Pledge Ministerial meeting in United Nation’s COP31 to review progress and advance methane mitigation by 30% from 2020 levels by 2030.
Meanwhile, ICOS shows that in this October, the European median methane concentration was 2054.2 ppb, only slightly higher than last year at the same time. This shows that the growth has slowed down. Over the full year 2025, methane at ICOS stations increased by 3.5 ppb, compared with about 10 ppb in 2024. Methane is still building up in the atmosphere, but in 2025 it grew at only a third of the previous pace.
“Growth rates vary a lot from one year to the next, so we should be careful about reading too much into a single year,” says Dr Joe Pitt from University of Bristol. “The growth in methane depends on emissions, such as wetlands, agriculture, waste and the production and use of fossil fuels, but also on changes in how quickly the atmosphere breaks methane down. Working out the relative role of each will take further analysis that combines observations with atmospheric models.”
“ICOS is preparing to measure methane isotopes at selected stations, which will tell us whether the changes are from fossil fuel emissions or not,” tells Dr Arnoud Frumau from The Netherlands Organisation of Applied Scientific Research, TNO. These new measurements will help in tracking the efficiency of climate actions, such as described in the Global Methane Pledge, signed by over 150 countries and EU.
Methane levels in Europe are higher than the global average, but the trends are similar
The ICOS Methane Curve shows that methane concentrations over Europe are somewhat higher than the global average. One reason is that most methane is emitted in the Northern Hemisphere and the tropics. Methane comes from natural sources, mainly wetlands, and from human activities such as livestock farming, rice cultivation, fossil fuel production and use and waste. Moreover, ICOS stations are relatively close to European emission sources, pushing the values up.
Over the longer term, however, the trend in the ICOS Methane Curve follows the global average reported by NOAA, because methane stays in the atmosphere long enough to mix well around the globe.
ICOS Curve tool shows greenhouse gas concentrations from different parts of Europe in a single view. It calculates both carbon dioxide and methane concentrations for any period the user selects. The data come from 40 labelled ICOS Atmosphere stations across Europe.
ICOS data support climate policy through the Global Carbon Budget and the WMO
“Through the ICOS Curve service, ICOS provides a timely, independent indication of changes in atmospheric greenhouse-gas growth, without waiting for the later publication of global background estimates,” says Alex Vermeulen, Director of the ICOS Carbon Portal.
ICOS published its CO₂ Curve a year ago, and it was immediately made available as a resource for the UN COP climate negotiations. Over the 12 months from November 2025 to October 2026, the median CO₂ concentration in the European atmosphere was 432.65 ppm (parts per million). This is 2.7 ppm higher than in the previous 12 months (November 2024 to October 2025), when it was 429.96 ppm. This increase reflects the continued rise of CO₂ driven mainly by the burning of fossil fuels.
“The ICOS Curves are an example of how the ICOS scientific community provides timely, science-based information for climate action and decision-making,” says Hannele Laine, ICOS Director General. ICOS also contributes greenhouse gas data to the annual Global Carbon Budget and to the World Meteorological Organization’s Global Greenhouse Gas Watch.
ICOS is funded by its 16 European member countries. The long-term national funding ensures continuity and transparency of climate monitoring.
A visualisation tool for teaching and presentations
The ICOS Curve tool is designed for presentations, teaching and climate communication. Users can choose stations and a time period and create a graph that suits their needs. For example, they can compare a remote background station, which shows little influence from nearby emissions, with a station in a densely populated, high-emission area of central Europe. The tool can also calculate growth rates for different time periods.
ICOS scientists are also developing visualisations based on data from ICOS Ecosystem stations, and new tools will be published in the coming months.
Learn more about the ICOS Methane and Carbon Dioxide Curves.