

ICOS Curve
The interactive ICOS curve above shows the change in CO2 concentrations in the atmosphere above Europe over time. The Curve uses observation data from 40 ICOS Atmosphere stations in Europe. It shows the median from these stations as a thick line and the differences between the stations as coloured areas.
The ICOS Curve enables an easy way to see the greenhouse gas concentrations from different parts of Europe in the same picture. The data is updated daily, giving recent information on CO2 concentrations and trends.
On the ICOS Curve tool at curve.icos-ri.eu, you can select one or several stations, visualise the data and compare the stations to the median of all ICOS stations, each other or to global averages. The ICOS Curve tool at curve.icos-ri.eu also has Methane and Nitrous Oxide curves in addition to the Carbon Dioxide visualisation.
What are the light blue and darker blue areas in the ICOS Curve?
The ICOS Curve shows daily updated observation data from the ICOS Atmosphere stations located in the Northern Hemisphere. The dark blue line is the median of the monthly values from all 38 stations. The darker blue area encompasses 50% of the values around this median; the lighter blue region encompasses 90% of the values around the median.
The shades tell that there is variation in the greenhouse gas concentration values measured at different stations, although all the stations measure exactly the same way. The stations are located all over Europe (and beyond) and the differences between them are due to regional influences: while, for example, one tower is in a region with high emissions, another is surrounded by forests and agricultural land. In addition, the weather influences the air flows to the stations, sometimes bringing air parcels from high-emission areas to far away regions.
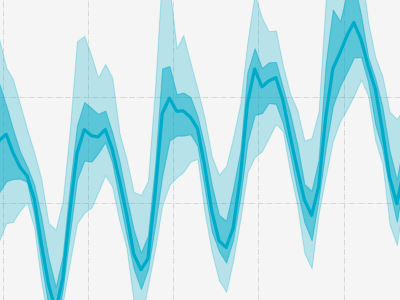
What are the ups and downs seen in the CO₂ and CH₄ curves?
The ups and downs in the Curves reflect the seasons (spring, summer, etc.), but the processes behind them are different for CO₂ and CH₄. Atmospheric CO₂ decreases in spring and summer due to the uptake of CO₂ by land ecosystems. During this time of the year, photosynthesis, the uptake of CO₂ by plants, is high. When leaves are falling in autumn, natural production of CO₂ by respiration and emissions from fossil fuel burning become larger than photosynthesis, and the CO₂ concentration increases again.
For CH₄, both the sources and sinks have a seasonal cycle, but different mechanisms. In the Northern Hemisphere, methane emissions from wetlands are a particularly important driver of seasonal variations. Methane is also removed from the atmosphere through reactions with hydroxyl radicals (OH), which are more abundant in summer. Together, these processes result in a less pronounced seasonal cycle than for CO₂.
The seasonal up-and-down pattern is more pronounced in the ICOS Curves than in the NOAA global averages or the Keeling Curve measured at Mauna Loa, because most ICOS Atmosphere stations are located at the continental land surface, where regional sources and sinks have a stronger influence. Despite these seasonal variations, both the ICOS Curves and NOAA global averages show a long-term increase in atmospheric CO₂ and CH₄ concentrations.
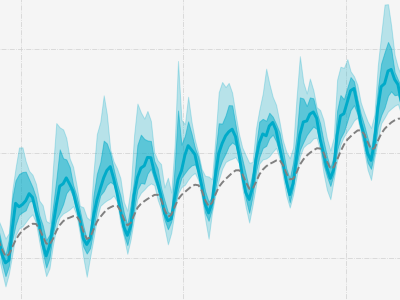
What is the grey dotted line in the ICOS Curve?
The grey dotted line is a product provided by NOAA, the National Oceanic and Atmospheric Administration of the US. It shows the monthly mean CO₂ or CH₄ concentration globally averaged over selected background marine surface sites. The ICOS Curves and the NOAA global averages show similar long-term growth trends in atmospheric CO₂ and CH₄ concentrations.
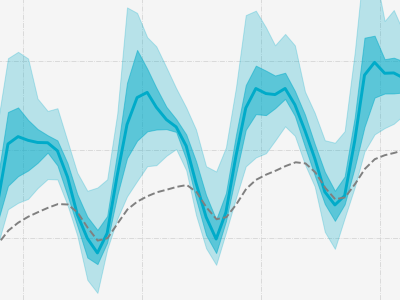
Why are European CO₂ and CH₄ concentrations higher than the global averages?
The blue ICOS Curve is almost constantly above the grey global dotted line, which means the European median concentrations of CO₂ and CH₄ are are higher than the global averages. This is partly because most ICOS Atmosphere stations are located in the Northern Hemisphere and close to regional emission sources.
For CO₂, the annual average value of the ICOS Curve is about 20–30 ppm higher than the global average. Europe is densely populated and emits vast amounts of CO₂ from fossil fuel burning. Consequently, Europe is a hotspot area for CO₂ compared to other regions or continents. The atmosphere mixes the CO₂ slowly, taking roughly two years for the gases to mix all over the globe. The more northerly location of ICOS stations also contributes to sharper and faster increases in autumn and early winter and minima in summer.
For CH₄, most of the difference can be explained by the fact that the Northern Hemisphere background concentration is higher than the Southern Hemisphere background. This is primarily because most methane emission sources are located in the tropics or the Northern Hemisphere, and mixing between hemispheres is slow. Methane emissions come from natural sources, mainly wetlands, and human activities such as agriculture, fossil fuel production and waste management. The European median measured by ICOS is even higher than the Northern Hemisphere background because the ICOS stations are close to European emission sources.
Methane is the second most important greenhouse gas after CO₂ emitted by human activities. Compared to CO₂, it is emitted in smaller quantities and remains in the atmosphere for a much shorter period of time.
Both the ICOS Curves and NOAA global averages show similar long-term growth trends in atmospheric CO₂ and CH₄ concentrations.