
Greenhouse gas levels once again reach record high
The WMO Greenhouse Gas Bulletin, published today on 27th November 2026, reports that the globally averaged surface concentration of CO₂ in 2025 was 426.8 parts per million, or 153% of the 1750 pre-industrial baseline.
Levels of carbon dioxide (CO2) and other major greenhouse gases in the atmosphere reached unprecedented highs in 2025, locking in more long-term temperature increase for the planet, according to a new report from the World Meteorological Organization (WMO). The WMO Greenhouse Gas Bulletin reports that the globally averaged surface concentration of CO2 in 2025 was 426.8 parts per million, or 153% of the 1750 pre-industrial baseline. Concentrations of methane and nitrous oxide - the second and third most important long-lived greenhouse gases related to human activities - also rose to new record levels.
“Another year, another new record. Greenhouse gases are trapping an unprecedented amount of heat in the atmosphere, providing energy for more extreme weather and associated risks to our economies and societies. The past 11 years have been the warmest on record and this trend is set to continue. CO2 has a very long life-time and so will affect the global climate not just for years but for decades and even centuries,” said WMO Deputy Secretary-General Ko Barrett.
WMO releases the Bulletin, one of its flagship annual publications, to provide authoritative scientific information for negotiators at the UN Climate conference. The COP 31 meeting in Antalya, Türkiye, from 9-20 November is seeking to turn climate commitments into concrete actions.

ICOS contributes to the Bulletin through its network of more than 40 high precision atmospheric measurement stations and through member of the editorial team Alex Vermeulen, Director of the ICOS Carbon Portal.
“Despite all the promises made by countries that signed the Paris Agreement in 2015, we still see no decline in the atmospheric growth rates of CO₂,” Alex Vermeulen says. “When I was born, CO₂ concentrations were at 320 ppm, and now they are at 426 ppm. If we continue on this path, the goal of limiting global warming to 2°C above pre-industrial levels will soon be out of reach. That is not a good prospect.”
“We can only hope that nature does us a service by continuing to absorb about half of all the CO₂ we emit. However, ongoing warming is making it harder for natural ecosystems to do this. We can see this with El Niño, which is intensified by warmer oceans and can reduce the ability of natural ecosystems to absorb CO₂,” he continues.
CO₂ growth rates tripled
The Bulletin reports on greenhouse gas concentrations - namely the amount of gas that accumulates in the atmosphere - and not new annual emissions. About half of the total CO₂ emitted each year remains in the atmosphere and the rest is absorbed by Earth’s land ecosystems and oceans.
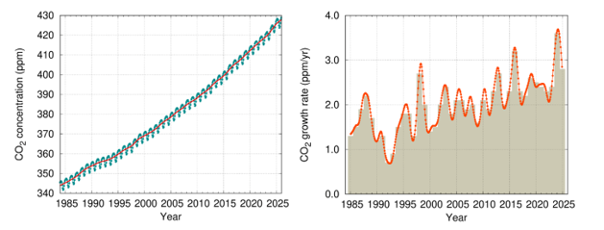
When the Bulletin was first published in 2004, the annual average level of CO2 measured by WMO’s Global Atmosphere Watch network of monitoring stations was 377.5 ppm. The National Oceanic and Atmospheric Administration (NOAA) Annual Greenhouse Gas Index shows that from 1990 to 2025, radiative forcing – the warming effect on our climate - by long-lived greenhouse gases increased by 56%, with CO₂ accounting for about 81% of this increase.
Growth rates of CO₂ have tripled since the 1960s, accelerating from an annual average increase of 0.8 ppm per year to 2.4 ppm per year in the decade from 2011 to 2020. From 2024 to 2025, the global average concentration of CO₂ rose by 2.8 ppm – above the decadal average but slightly less than the exceptional surge of 2023/2024.
“The more modest growth rate from 2024 to 2025 reflects recovery of the land carbon sinks and reduced fire carbon emissions in 2025 after the strong 2023/2024 El Nino, which reduced the efficiency of the biosphere through more drought, drier vegetation and more wildfires,” said WMO senior scientific officer Oksana Tarasova.
“However, a 2.8 ppm annual increase is still a substantial addition of carbon to the atmosphere from fossil fuel burning. We can expect to see a further increase in concentrations in 2026 because of fossil fuel burning and the development of a powerful El Niño which will impact land carbon sinks as it did in 2023/2024. The risks of reduced CO₂ uptake by the ocean are also increasing in our changing climate,” said Oksana Tarasova.
The growth is also seen in the ICOS Curve, an interactive tool shows the change in carbon dioxide, methane and nitrous oxide concentrations in the Northern Hemisphere over time as measured by ICOS stations. ICOS Curve, covering data from 2017 onwards, uses observation data from 40 ICOS Atmosphere stations in Europe.
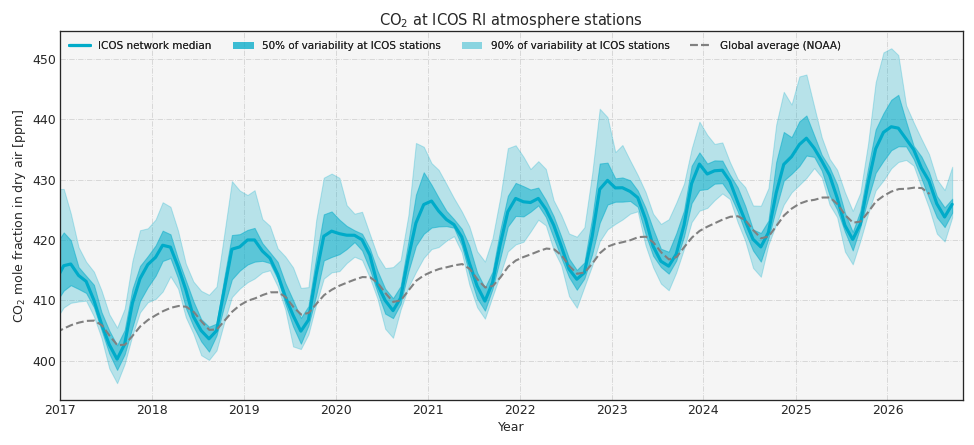
“CO₂ levels in the atmosphere vary depending on location and time, and in the Northern Hemisphere they generally increase with latitude. Concentrations are lower in summer due to CO₂ uptake by plants and higher in winter due to emissions from fossil fuels and respiration from plants and soils,” Alex Vermeulen explains.
“The ICOS Curve shows these seasonal changes as a repeating pattern, while the blue areas around the median show the differences between stations. The closer a station is to emission sources and vegetation, the larger these variations tend to be.”
“When measured precisely and combined with atmospheric transport models, these variations tell us how plants, oceans and human emissions contribute to atmospheric CO₂ concentrations. This information helps us understand how the capacity of oceans and plants to absorb CO₂ is changing, and whether we are succeeding in reducing fossil fuel emissions,” he continues.
Methane and nitrous oxide
Methane accounts for about 16% of the warming effect on our climate by long-lived greenhouse gases but it has a much shorter lifetime than CO2. Approximately 35% of methane is emitted into the atmosphere by natural sources (for example, wetlands) which are sensitive to climate as well, and about 65% comes from anthropogenic sources such as cattle, rice farming, fossil fuel exploitation, landfills and biomass burning.
The globally averaged methane concentration in 2025 was 1948 parts per billion (ppb) – or 267% of the 1750 level.
Nitrous oxide is the third most important long-lived greenhouse gas and comes from both natural sources and due to human activities such as biomass burning, fertilizer use and various industrial processes. The globally averaged concentration of N2O reached 339.1 ppb in 2025, 126% above 1750.
European nitrous oxide and methane concentrations, as measured by 40 ICOS Atmosphere station, can also be explored in the ICOS Curve.
- Read the WMO Greenhouse Gas Bulletin: https://library.wmo.int/records/item/69986-no-22-27-october-2026
- Read the WMO press release: https://wmo.int/resources/publication-series/greenhouse-gas-bulletin/no-22
Explore the ICOS Curve: https://www.icos-cp.eu/impact/icos-curve
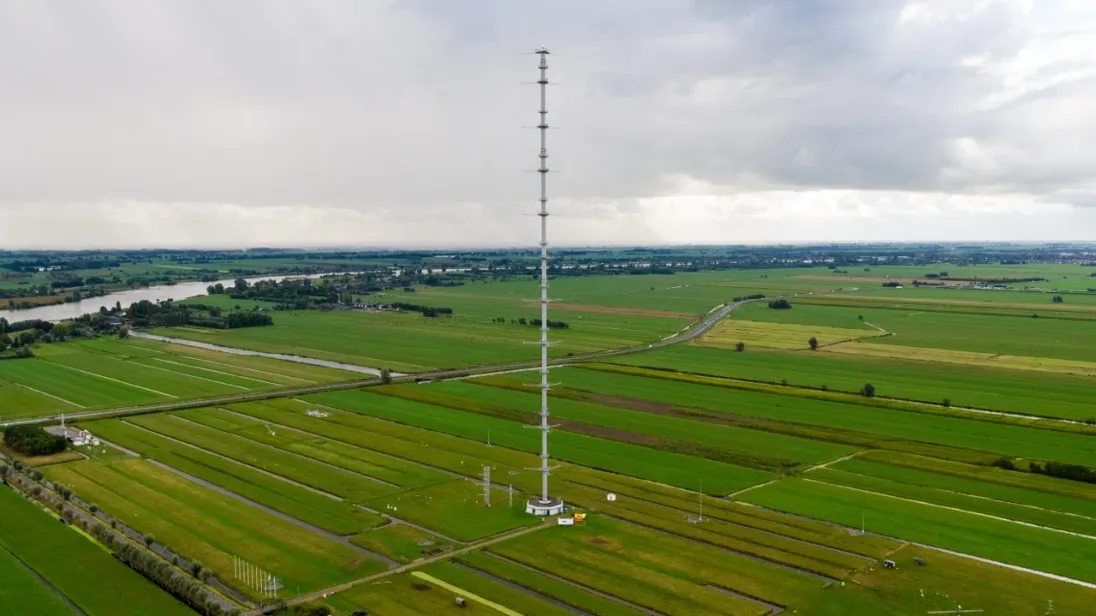
Picture from the ICOS Atmosphere station Cabauw in the Netherlands by Groene Hart, Tom Oudijk, Sander Karsen, Dennis Manda - Mandaproductions.