
Set up an observational monitoring system
To monitor and verify that climate plans are delivering real-world results, cities can apply a robust, independent observational monitoring system. This service details the design and deployment of systems that use multiple measurement technologies to track emissions in real-time.
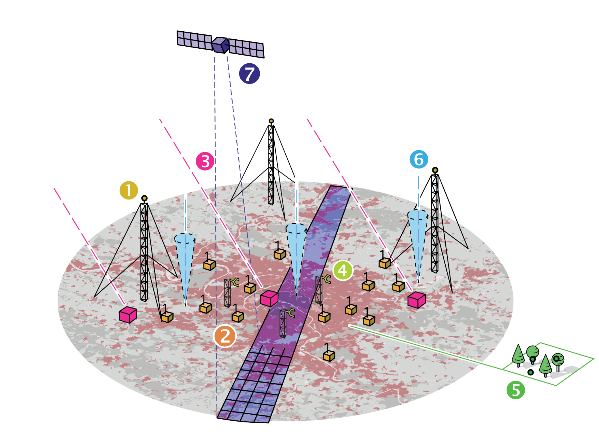

Introduction to the measurement technologies
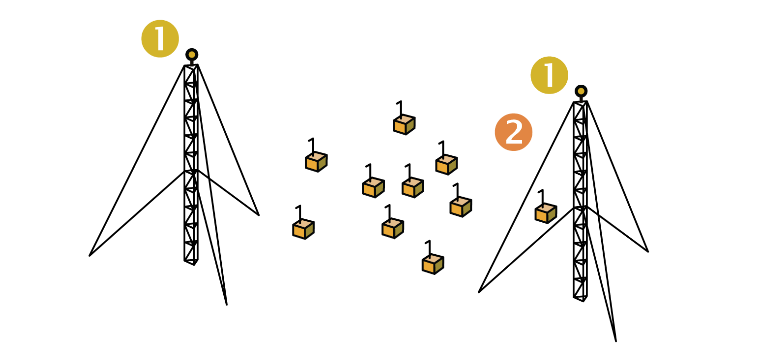
High-precision Atmosphere measurements on tall towers around a city
High-precision atmosphere measurements compare the upwind to the downwind concentration of GHGs to calculate the total emissions of a city. These systems are designed to provide highly accurate, standardized, and continuous data streams crucial for atmospheric inversion modeling. Since they inform about the total emissions of a city, high-precision Atmosphere measurements are a powerful tool for verification and communication of a city’s progress in climate action. However, these measurements are costly.
Roof and street level concentration measurements inside the city
The use of mid-cost and low-cost sensor technologies for greenhouse gas (GHG) monitoring in urban areas has been a cornerstone of the ICOS Cities project. They also monitor the concentration of GHGs but in a denser array within the city resulting in the detailed observations of the emission pattern. The information gained improves the inventory and verifies the success of specific measures in the climate action plan. With diligent distribution, they might also enable the calculation of the total emissions on a city and its changes over time.
Measurements of CO2 concentration around and within a city must be combined with a specific modeling approach called ‘inverse modeling’ to interpret them and unlock their full potential in improving the inventories (see Step 7 in Figure 1).
Case study: Eddy covariance on tall towers
EC towers measure the net exchange (flux) of GHGs between the city surface and the atmosphere. They provide a high-frequency, integrated picture of emissions over a wide area. To make this data actionable, the Flux Footprint Calculation (FFP, Kljun et al. 2015) model is essential.
FFP significance: FFP calculates the probability that emissions from specific locations contributed to the tower's measurement.
Dynamic source mapping: The footprint is dynamic—it shifts constantly based on wind direction and atmospheric mixing—providing a real-time map of the measurement's source area, tying the flux data directly to specific neighbourhoods or industrial areas.
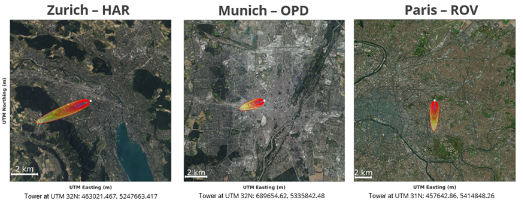
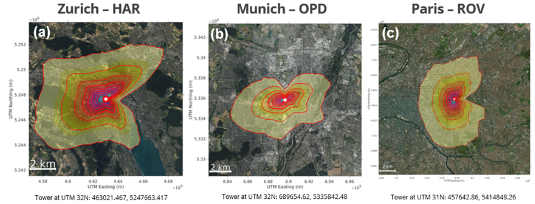
After two years of operation across the towers, this method has provided a clearer picture of how neighbourhoods, roads, or industrial areas contribute differently to city-wide emissions.
Multi-scale observations improve inventories
Concentration measurements with inverse modeling as well as flux measurements by eddy covariance from tall towers provide information where emissions come from, thus allowing to test and improving emission inventories. By combining detailed inventories of emissions by sector (e.g., traffic, residential, or commercial buildings), we can model what the observations should detect. These modelled concentrations or fluxes can then be compared directly to the real-world measurements from the towers.
By identifying which sectors or neighbourhoods drive discrepancies, cities gain a sharper, evidence-based understanding of their emissions. This makes their climate action plans more realistic and adaptive to on-the-ground conditions. The data gives practical input for climate governance, helping policymakers track whether emission reduction measures are actually working. Policymakers can move beyond abstract numbers to reveal the real emissions landscape of a city, allowing for policies and investments that are better grounded in what is actually happening. In ICOS Cities, this approach of combining detailed inventories with observations has been called ‘Inventory+’ concept.
The core value of the observational system lies in its ability to independently verify emission inventories. Combining observations with detailed inventories allows cities to pinpoint when and where emission reduction measures are succeeding or failing, leading to more immediate and targeted policy adjustments.
Key takeaways
City Administrators
Invest in a multi-scale observational system. This provides an independent, real-time audit of emissions, making climate action measurable and accountable.
Businesses
Collaborations on mid- and low-cost sensors offer opportunities for innovation and scaling of climate services that cities can use to track their goals.
Researchers
Integrating tower data, dynamic flux footprints, and emission inventories provides a powerful, validated framework to inform urban climate governance.
Dive Deeper
Molinier, B., Kljun, N., 2025. Footprints for the flux towers in three pilot cities. ICOS ERIC - Carbon Portal. https://doi.org/10.18160/9VPH-CA6E
Kljun, N., Calanca, P., Rotach, M. W., and Schmid, H. P.: A simple two-dimensional parameterisation for Flux Footprint Prediction (FFP), Geosci. Model Dev., 8, 3695–3713, https://doi.org/10.5194/gmd-8-3695-2015 , 2015.
Hilland, R., Hashemi, J., Stagakis, S., Brunner, D., Constantin, L., Kljun, N., Kunz, A.-K., Molinier, B., Hammer, S., Emmenegger, L., and Christen, A.: Sectoral attribution of greenhouse gas and pollutant emissions using multi-species eddy covariance on a tall tower in Zurich, Switzerland, Atmos. Chem. Phys., 25, 14279–14299, https://doi.org/10.5194/acp-25-14279-2025 , 2025.
Zhao, X., Chen, J., Marshall, J., Gałkowski, M., Hachinger, S., Dietrich, F., Shekhar, A., Gensheimer, J., Wenzel, A., and Gerbig, C.: Understanding greenhouse gas (GHG) column concentrations in Munich using the Weather Research and Forecasting (WRF) model, Atmos. Chem. Phys., 23, 14325–14347, https://doi.org/10.5194/acp-23-14325-2023 , 2023.
Lan, C., Holst, C.C., Grünwald, T. et al. Linkage Between Vertical Coupling and Storage Flux: Insights from Urban Tall-Tower Eddy Covariance Measurement. Boundary-Layer Meteorol 191, 4 (2025). https://doi.org/10.1007/s10546-024-00894-6
Kunz, A.-K., Borchardt, L., Christen, A., Della Coletta, J., Eritt, M., Gutiérrez, X., Hashemi, J., Hilland, R., Jordan, A., Kneißl, R., Legendre, V., Levin, I., Preunkert, S., Rubli, P., Stagakis, S., and Hammer, S.: A relaxed eddy accumulation flask sampling system for 14C-based partitioning of fossil and non-fossil CO2 fluxes, Atmos. Meas. Tech., 18, 5349–5373, https://doi.org/10.5194/amt-18-5349-2025 , 2025.
Grange, S. K., Rubli, P., Fischer, A., Brunner, D., Hueglin, C., and Emmenegger, L.: The ZiCOS-M CO2 sensor network: measurement performance and CO2 variability across Zurich, Atmos. Chem. Phys., 25, 2781–2806, https://doi.org/10.5194/acp-25-2781-2025 , 2025.
Holst, C., Lan, C., Mauder, M., Molinier, B., Kljun, N., Chen, J., 2026. Documentation and scientific analysis of sensitivities of cityscale emission estimation sensitivity to wind and surface fluxes. ICOS ERIC - Carbon Portal. https://doi.org/10.18160/1BEK-J8F1

PAUL, Pilot Applications in Urban Landscapes - Towards integrated city observatories for greenhouse gases (ICOS Cities), has received funding from the European Union’s Horizon 2020 Research and Innovation Programme under grant agreement No 101037319.