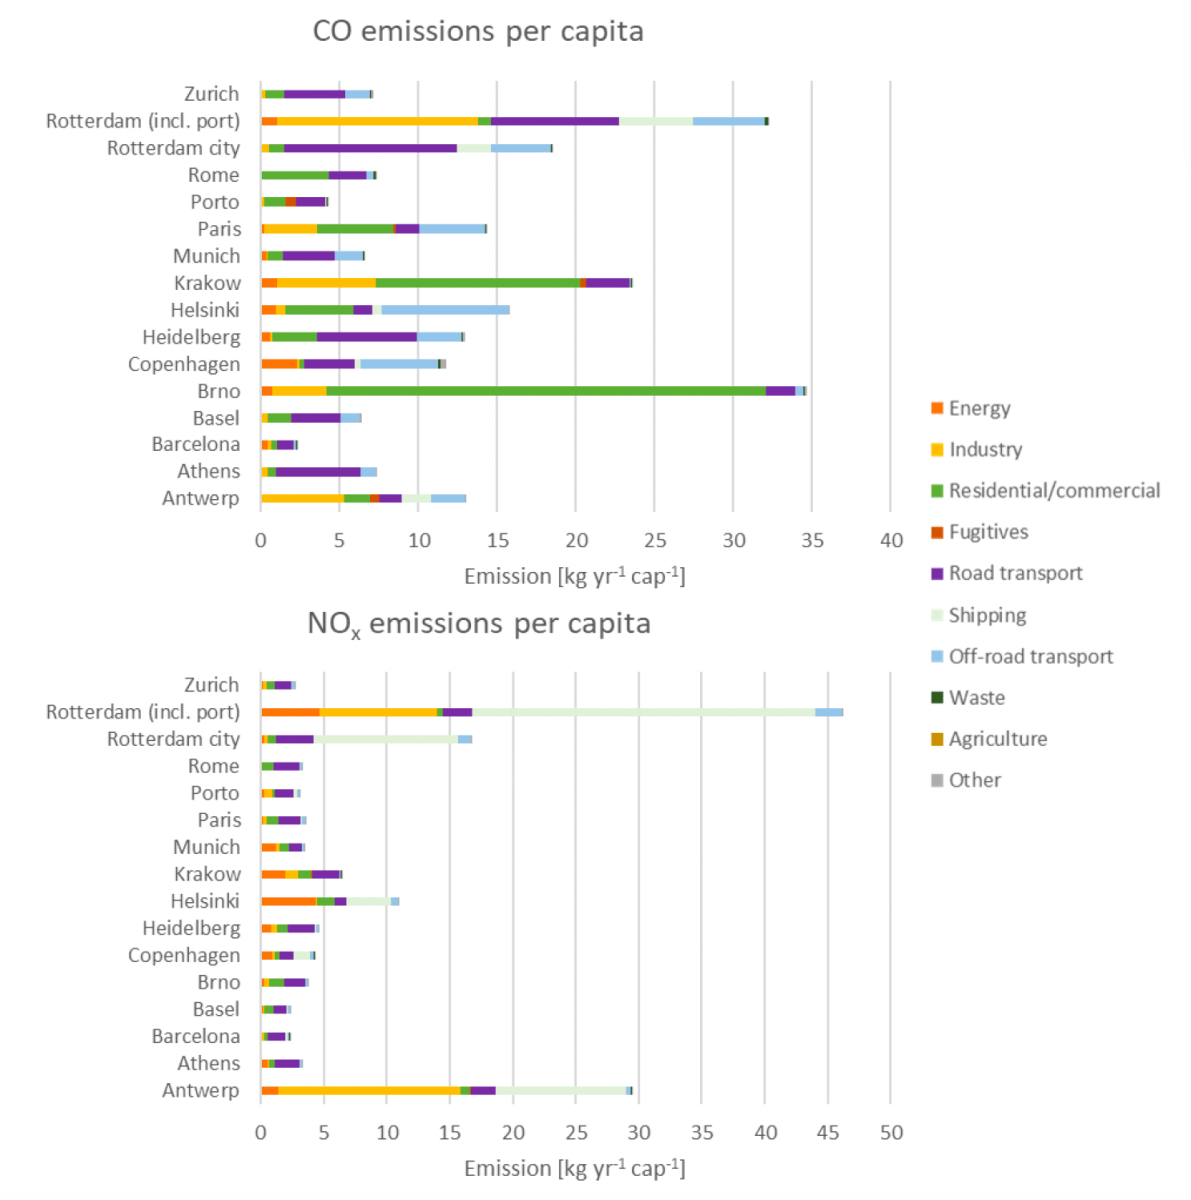
Sector-wise city emission estimates for 15 European cities
Whether you are looking to cut your city’s climate impact or improve local air quality, having the right data is the first step. This section showcases how our emission tool can help you pinpoint exactly where your challenges—and your opportunities—lie.
Download Guidelines
We’ve broken down the data to show you which sectors (like transport, industry, or housing) are contributing most to your city's footprint. This allows you to move from general goals to targeted, effective local actions.
We have analysed 16 European cities to help you visualise emission trends. For each city, you will see:
- Emission maps: A bird’s-eye view of your city’s pollution. You can spot the "hotspots" where emissions are most concentrated, which helps in deciding where to focus interventions.
- Sector breakdowns: Easy-to-read charts that compare your city’s emissions to the regional average. This helps you identify if a specific sector—like road transport—is unusually high compared to similar cities.
- Greenhouse gases vs. air ollutants: We track both long-term climate contributors and immediate health-impacting pollutants, so you can address both climate and health goals simultaneously.
A note on the data
These figures provide a highly useful "first-order" look at your city's emissions.
Please keep in mind that this data is designed to act as a strategic guide, not as a final, absolute audit. Different data sources can produce different results, so we recommend using these insights as a starting point to build your strategy, rather than as the only source of truth. If a chart shows your city has a high share of road transport emissions, it’s a strong signal to look closer at your local traffic management and public transport policies.
Featured cities
We have included detailed emission estimate profiles for the following cities:
- Antwerp
- Athens
- Barcelona
- Basel
- Brno
- Copenhagen
- Heidelberg
- Helsinki
- Krakow
- Munich
- Paris
- Porto
- Rome
- Rotterdam (City)
- Rotterdam (Port)
- Zurich

PAUL, Pilot Applications in Urban Landscapes - Towards integrated city observatories for greenhouse gases (ICOS Cities), has received funding from the European Union’s Horizon 2020 Research and Innovation Programme under grant agreement No 101037319.