Last update: version 1.3; 3 March 2021
Previous version: version 1.2; 11 December 2020
Contact info: info@globalcarbonproject.org
Article doi: https://doi.org/10.1038/s41558-020-0797-x
Data doi: https://doi.org/10.18160/RQDW-BTJU (this page)
Citation of this data supplement:
Le Quéré, C., Jackson, R., Jones, M., Smith, A., Abernethy, S., Andrew, R., De-Gol, A., Shan, Y., Canadell, J., Friedlingstein, P., Creutzig, F., & Peters, G. (2020). Supplementary data to: Le Quéré et al (2021), Temporary reduction in daily global CO2 emissions during the COVID-19 forced confinement (Version 1.3). Global Carbon Project. https://doi.org/10.18160/RQDW-BTJU
Original Article - Le Quéré et al. (2020):
Corinne Le Quéré, Robert B. Jackson, Matthew W. Jones, Adam J. P. Smith, Sam Abernethy, Robbie M. Andrew, Anthony J. De-Gol, David R. Willis, Yuli Shan, Josep G. Canadell, Pierre Friedlingstein, Felix Creutzig and Glen P. Peters. Temporary reduction in daily global CO2 emissions during the COVID-19 forced confinement. Nature Climate Change (2020), https://doi.org/10.1038/s41558-020-0797-x
Commentary Article Including Latest Updates – Le Quéré et al. (2021)
Corinne Le Quéré, Glen P. Peters, Pierre Friedlingstein, Robbie M. Andrew, Josep G. Canadell, Steven J. Davis, Robert B. Jackson, Matthew W. Jones. Fossil CO2 emissions in the post-COVID era. Nature Climate Change (2021). https://doi.org/10.1038/s41558-021-01001-0
Datasets:
A) Estimated emissions including countries’ share of international transport (as in original publication):
- All files in one zip-archive (download) zip archive with 3 excel files, 4.2 MB
- Data file 1: Change in CO2 emission per country and by sector (download) excel file, 3226 kB
- Data file 2: Change in CO2 emission per USA state and by sector (download) excel file, 2232 kB
- Data file 3: Change in CO2 emission per Chinese province and by sector (download) excel file, 1209 kB
B) Estimated emissions following UNFCCC national accounting (with international transport in global total only, as in the Global Carbon Budget 2020):
- All files in one zip-archive (download) with 3 excel files, 4.0 MB
- Data file 4: Change in CO2 emission per country and by sector (download) excel file, 3154 kB
- Data file 5: Change in CO2 emission per USA state and by sector (download) excel file, 2166 kB
- Data file 6: Change in CO2 emission per Chinese province and by sector (download) excel file, 1145 kB
Introduction
Government policies during the COVID-19 pandemic have drastically altered patterns of energy demand around the world in 2020. Many international borders were closed and populations were confined to their homes, which reduced transport and changed consumption patterns. Confinement policies evolved during the year in response to multiple virus outbreaks, triggering additional waves of restrictions in many countries, which have continued in to 2021. Here, we compile government policies and activity data to estimate the patterns of CO2 emissions during confinements up to 11th January 2021.
Main results
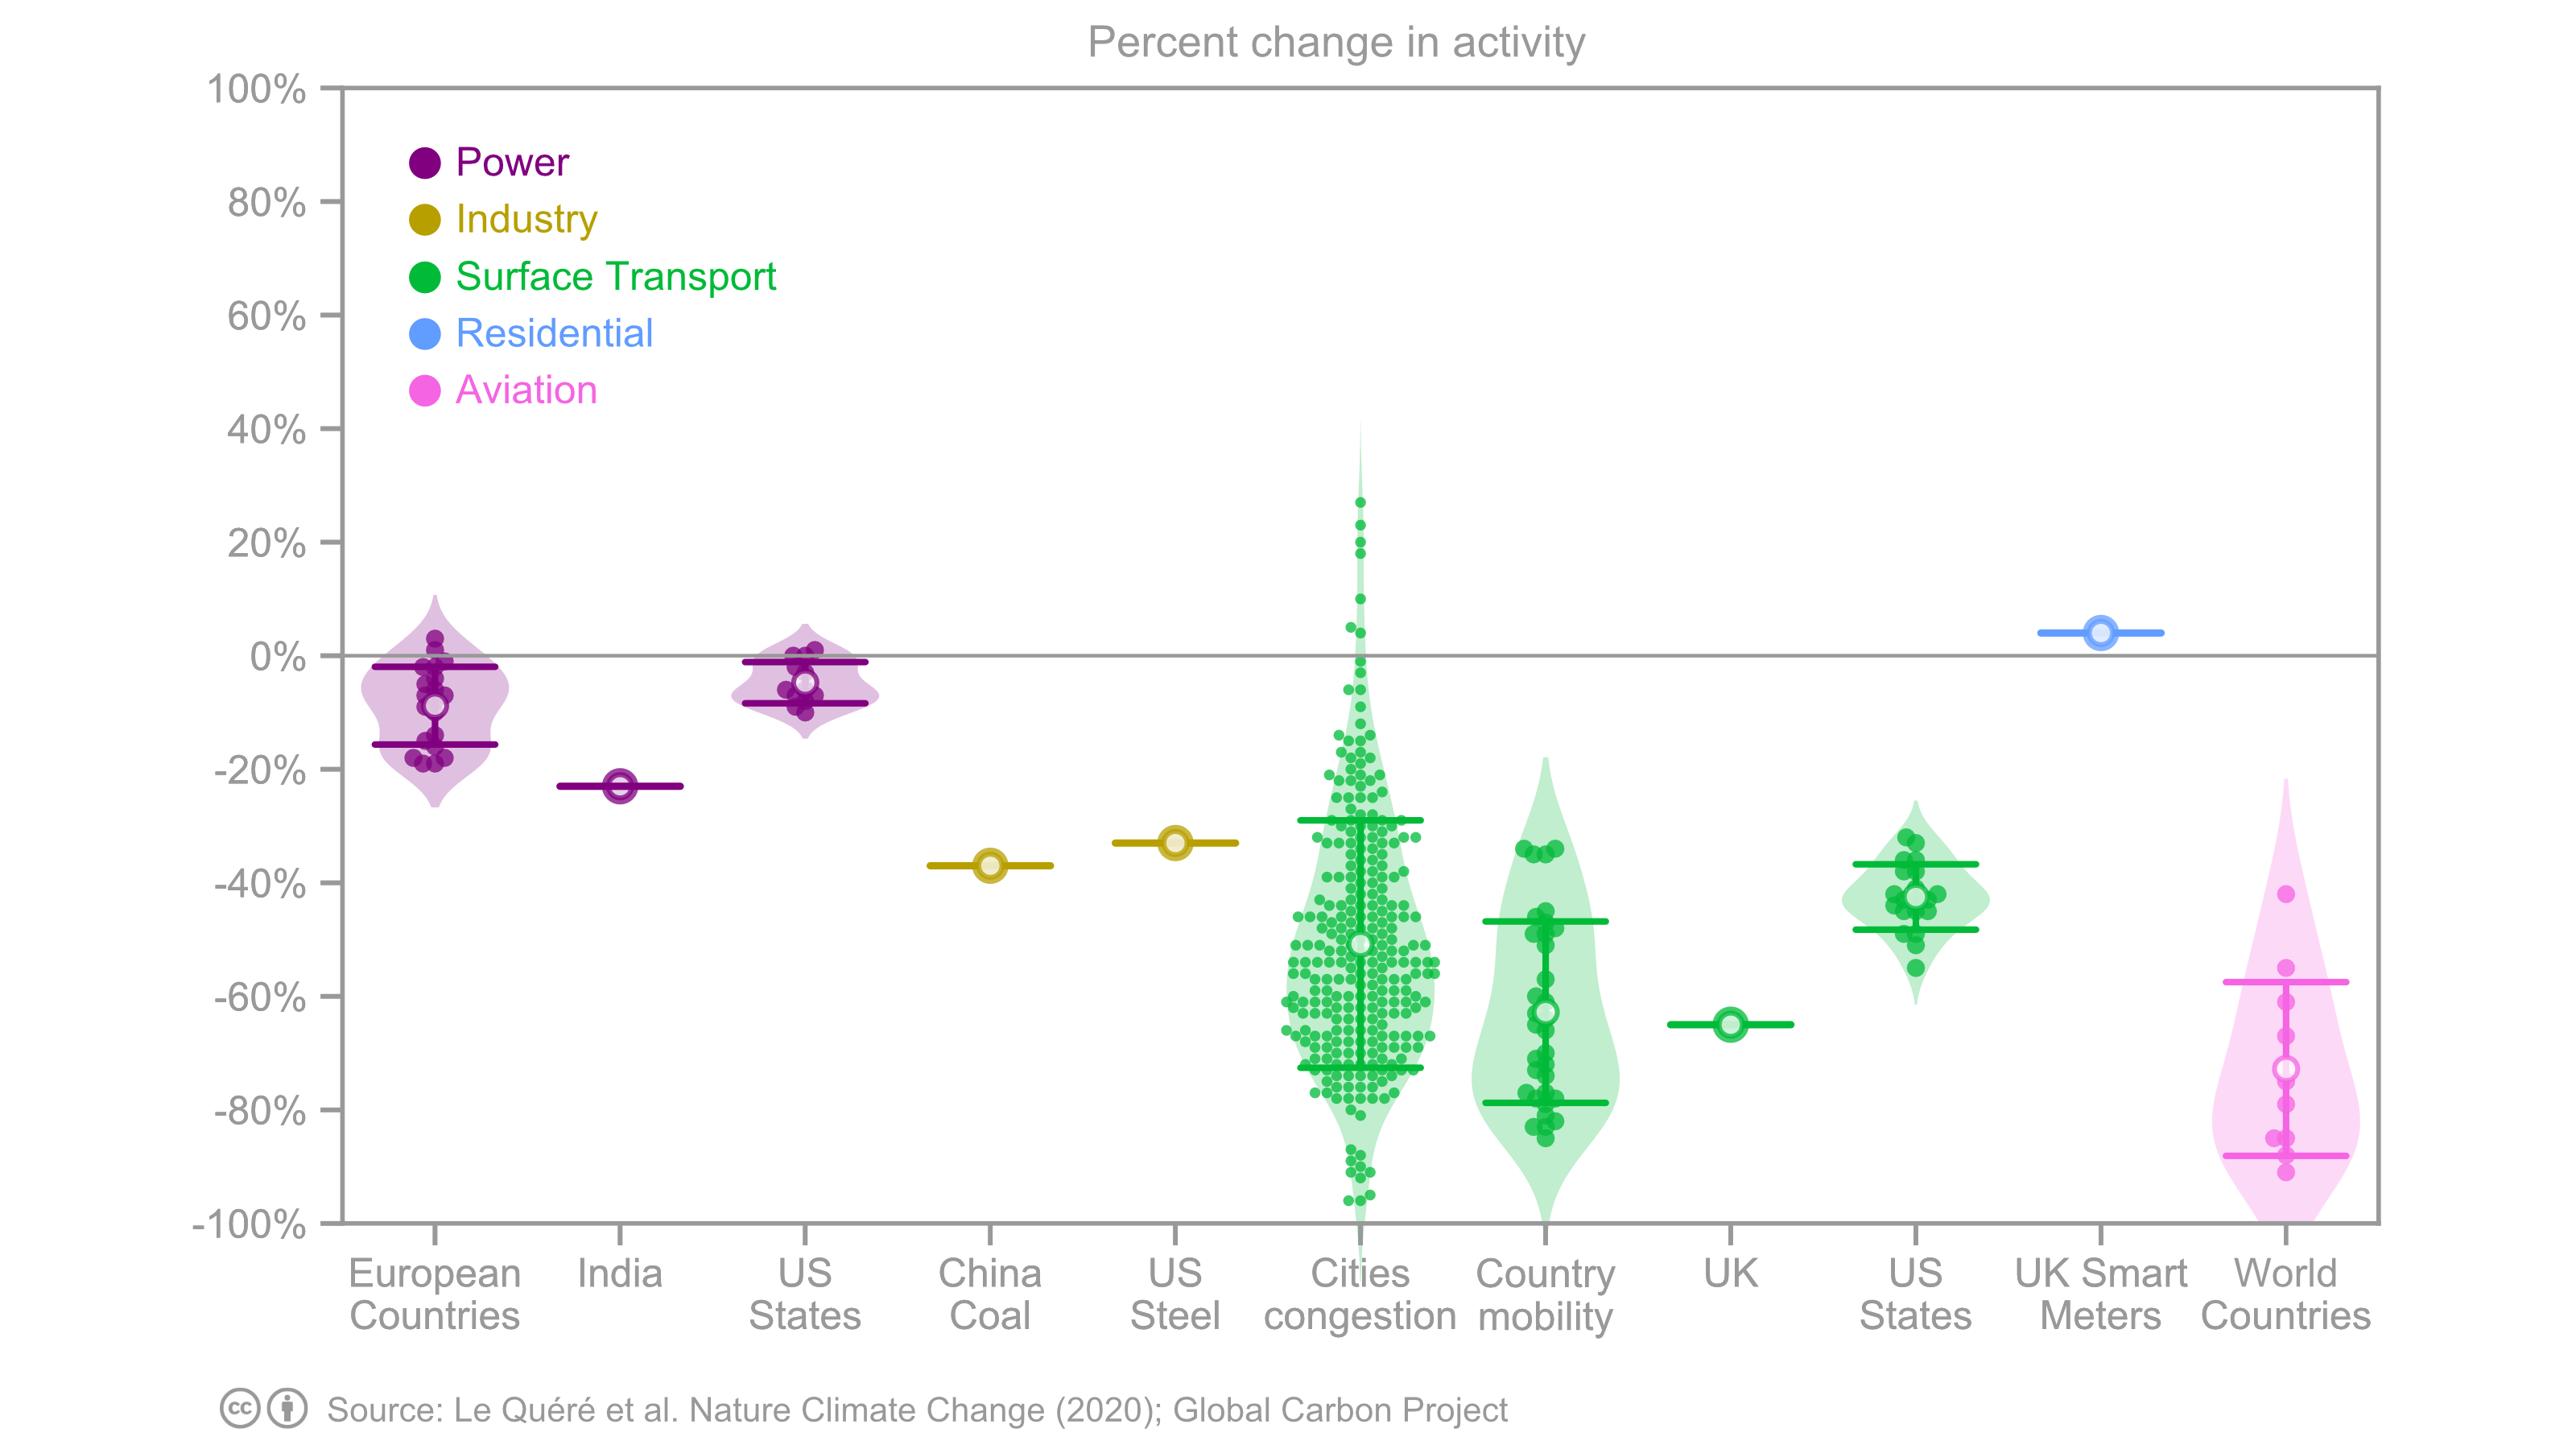
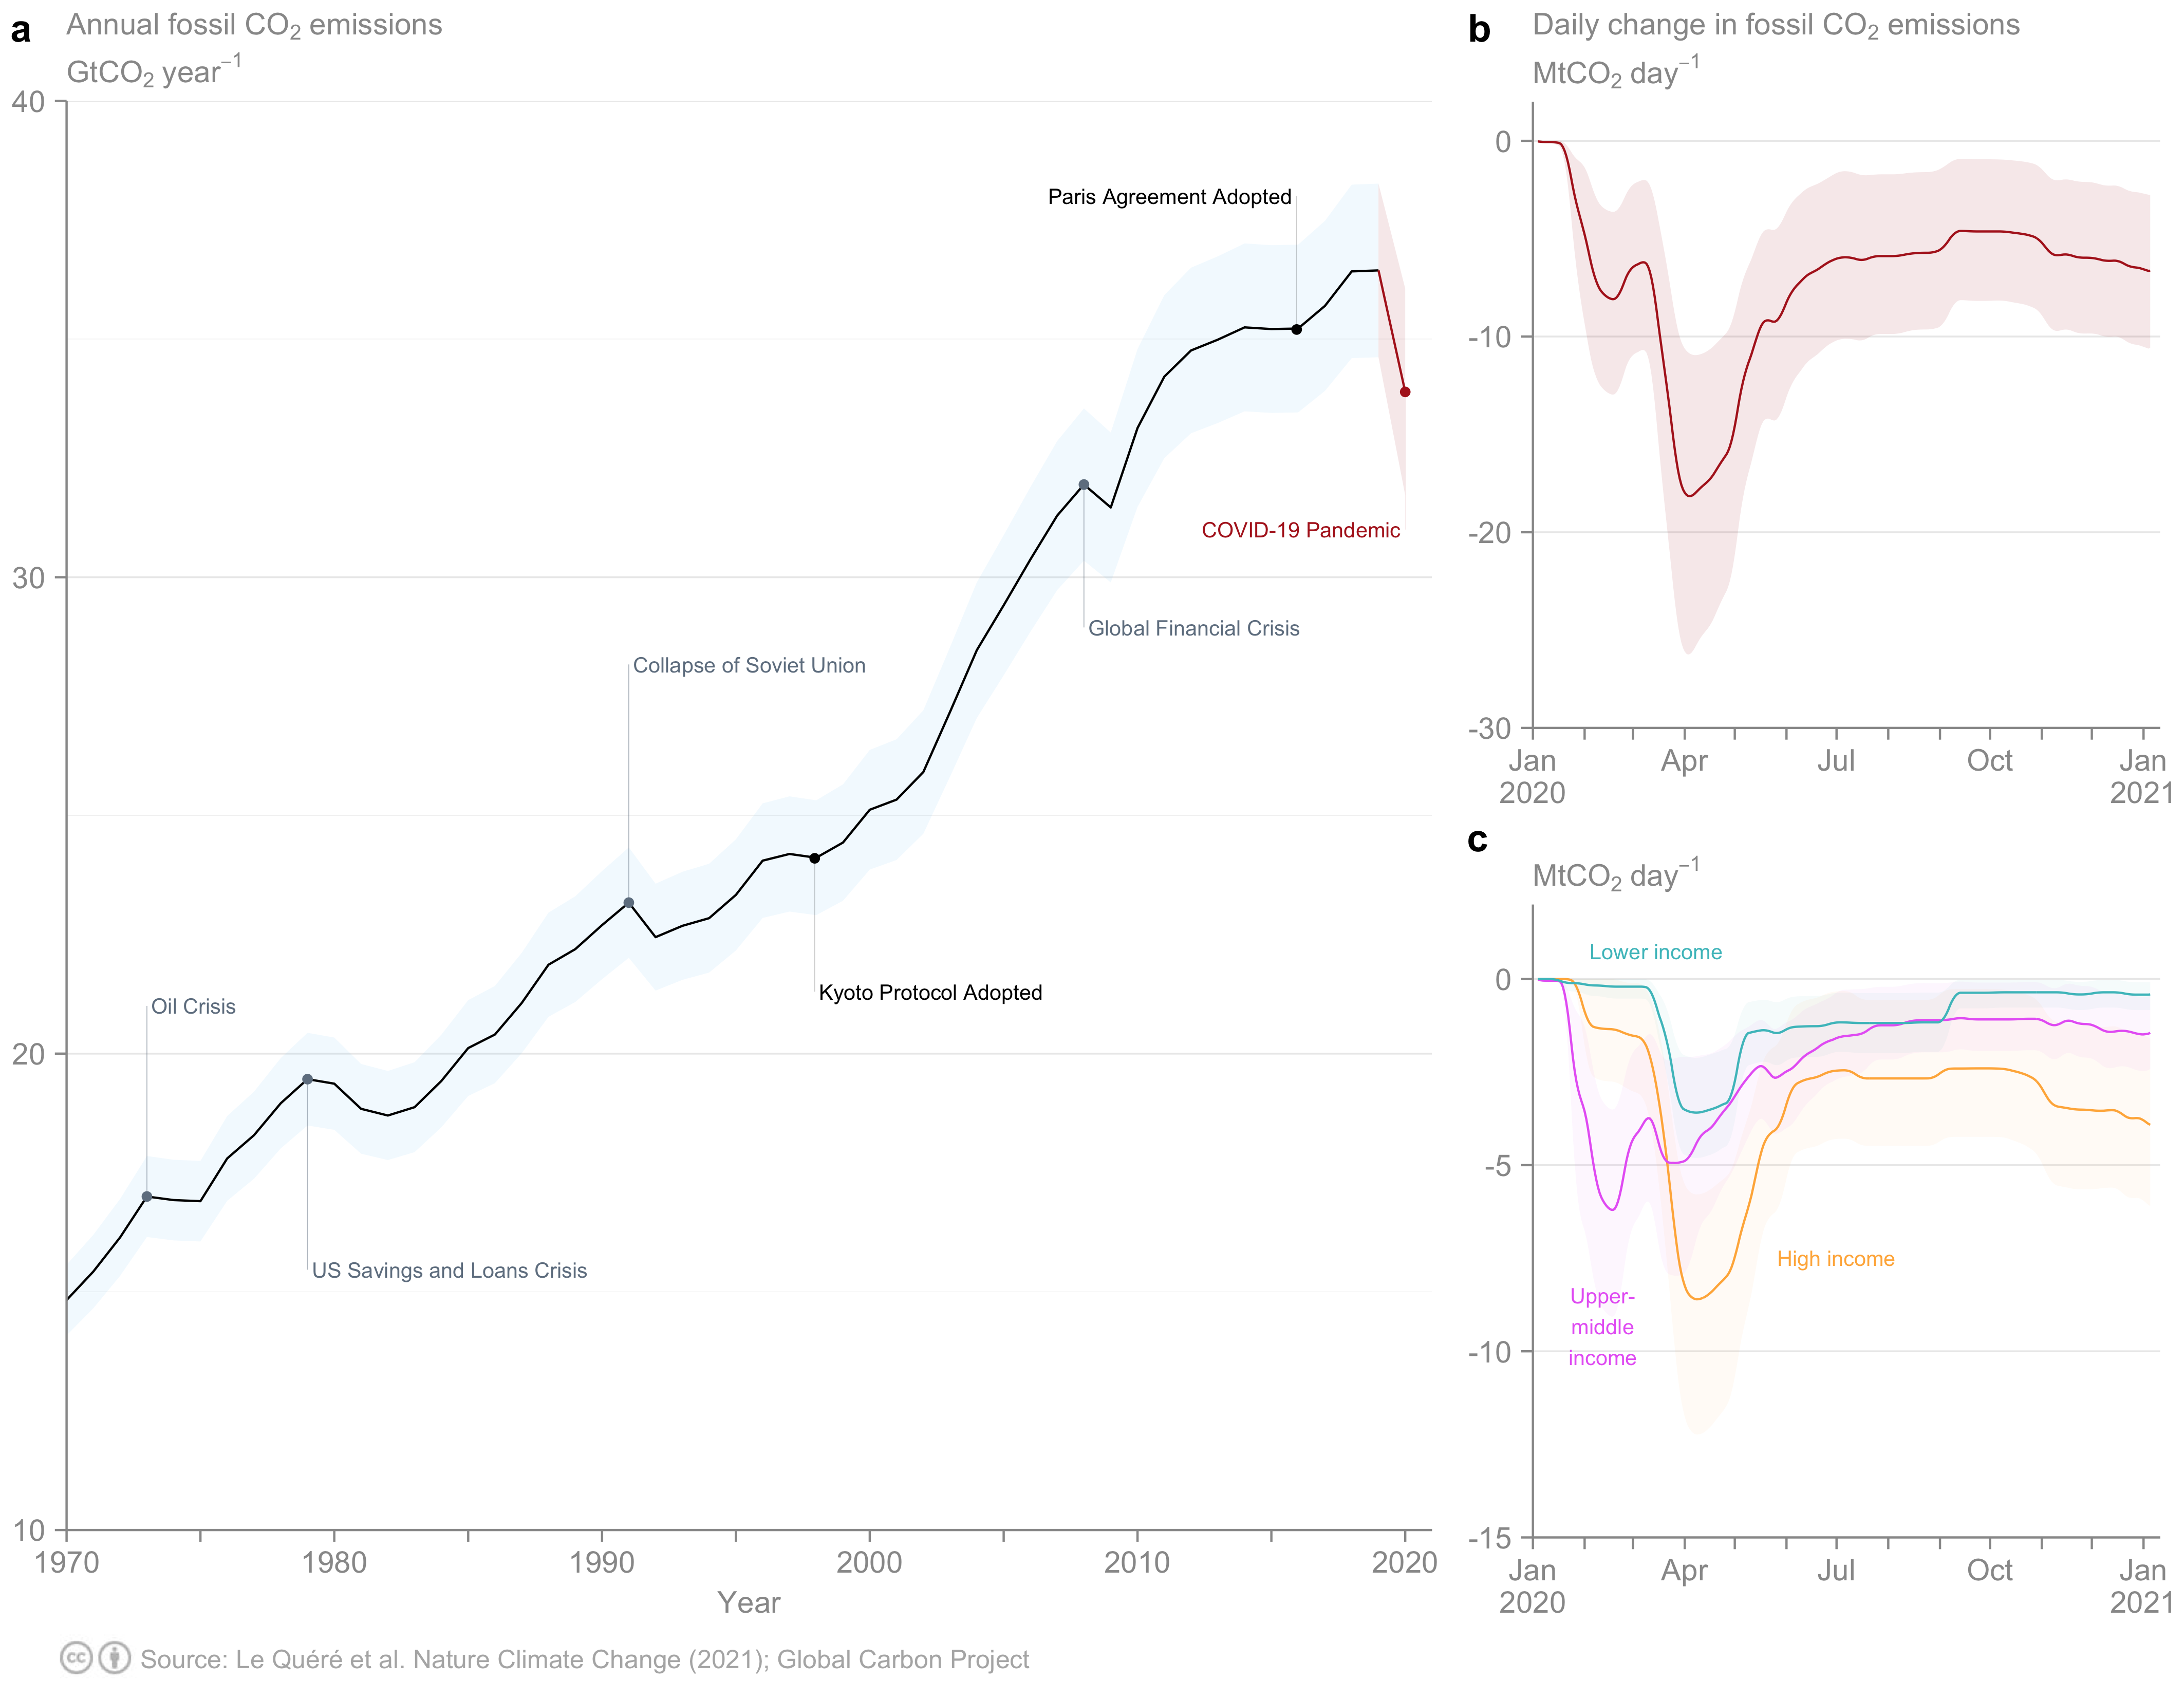
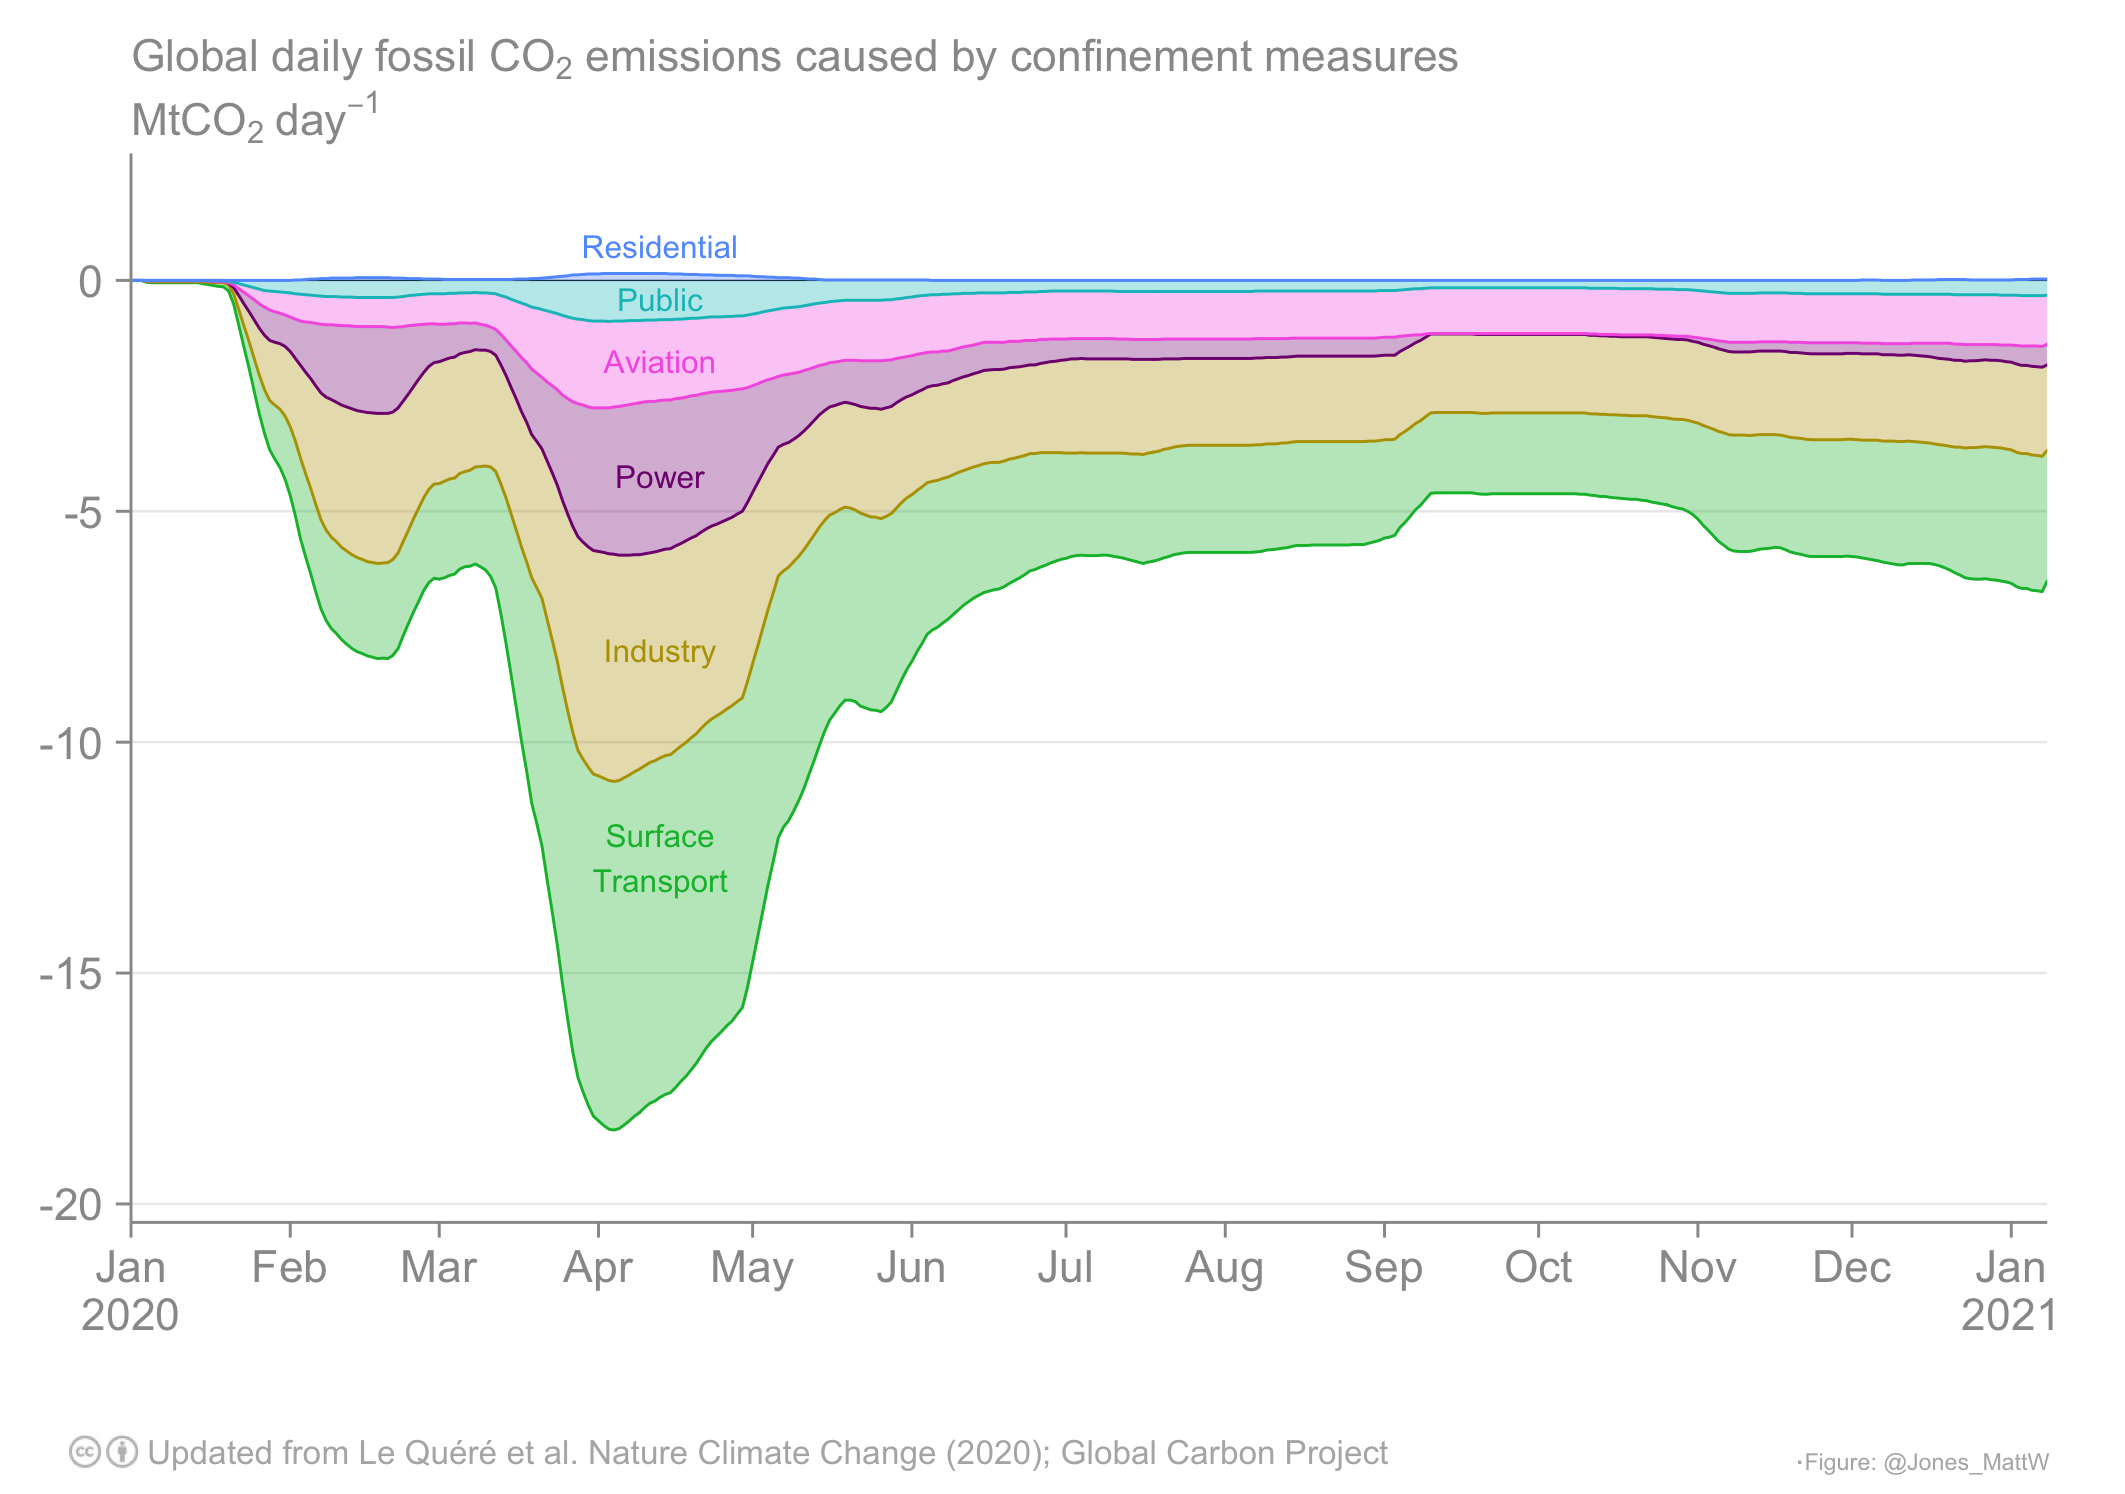
At their peak in early April 2020, daily global CO2 emissions decreased by –19% (–11 to –27% for ±1σ) compared with the mean 2019 levels, with just under half of this total change occurring due to changes in surface transport. At their peak, emissions in individual countries decreased by –27% on average. Based on the latest data, we estimate that the annual emissions fell by –7% (–3% to –11 %) in 2020, reflecting the persistence of some level of restriction in many countries throughout the year. Government actions and economic incentives post crisis will likely influence the global CO2 emissions path for decades to come.
Figures